Microbiome-wide PheWAS links gut microbial SNVs to health and exposures
Main The gut microbiome exhibits large variations in its composition and genetic landscape. Within-species genetic variation underlies strain differences in fitness, metabolic capacities, pathogenicity and other biological properties. Thus, the field of microbiome research is moving towards strain-level or genetic-leve
Main The gut microbiome exhibits large variations in its composition and genetic landscape. Within-species genetic variation underlies strain differences in fitness, metabolic capacities, pathogenicity and other biological properties. Thus, the field of microbiome research is moving towards strain-level or genetic-level dissection of the microbial contributions to human health ( Supplementary Information ).
Structural variations in the gut microbiome have been linked to human body mass index (BMI), bile acid concentrations, the human plasma metabolome and host genetics, thereby identifying bacterial genes involved in glucose metabolism, bile acid biosynthesis and biotransformation, and N -acetylgalactosamine utilization 3 , 4 , 5 , 6 .
However, gut microbial genomes also contain abundant SNVs that can modulate microbial function and host interactions. For example, a SNV in the blc gene of Escherichia coli disrupts the intestinal barrier by decreasing the amount of lysophosphatidylethanolamine, a metabolite that aids remission of inflammatory bowel disease 7 .
In the stomach, a SNV in Helicobacter pylori increases gastric cancer risk by enhancing the proteolytic activity of the serine protease HtrA (ref. 8 ). In Bacteroides coprocola , SNVs in glycosyl hydrolase genes have been associated with type 2 diabetes 9 .
A SNV-based metagenome-wide association study (SNV-MWAS) in an Israeli population identified BMI-associated SNVs that were replicated in a geographically independent Dutch cohort 10 . Despite these examples, systematic explorations of the relationships between gut microbial SNVs and host phenotypes have not, to our knowledge, been carried out at phenome-wide scale.
Such analyses require large-scale human cohort data with both metagenomic and deep phenotypic data, and they need to overcome a number of technical challenges. For example, microbial species exhibit complex population genetic structures, and these strong lineage effects may lead to false discoveries in association studies if population structure is not properly controlled.
In this study, we compiled shotgun metagenomic sequencing data of 11,831 faecal samples from 5 independent cohorts from the Netherlands and a cohort from Tanzania. Gut microbial genotypes were characterized using GT-Pro 11 , yielding 12.8 million SNVs in core genomic regions. We further developed a linear mixed-model (LMM)-based analysis workflow that controls for within-species population genetic structure to ensure that SNV–phenome associations detected are independent from the cumulative effect of strain lineage.
We then conducted a PheWAS to identify associations between common metagenomic SNVs and 244 host phenotypic and exposure factors, using LMM in each cohort, followed by meta-analysis. In total, we detected 940 independent association signals supported by multiple cohorts that link 39,663 SNVs across 101 species to 69 host phenotypes or exposures, and the full set of results are available in an online catalogue.
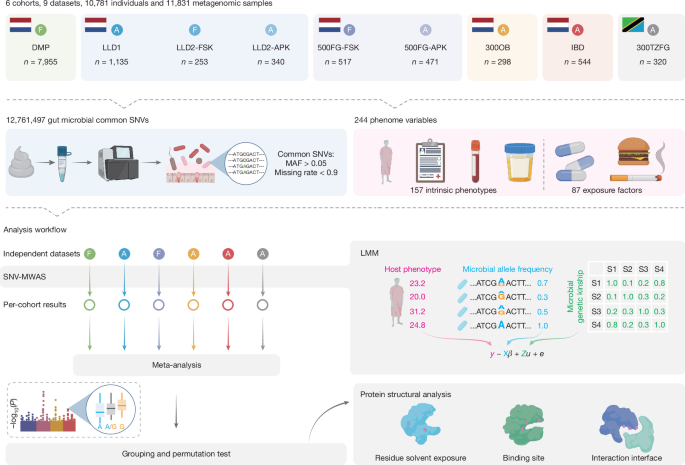
We also performed protein structural analyses to interpret the biological relevance of these associations. Gut microbial SNV landscape We compiled faecal metagenomic sequencing data for 11,831 samples from 10,781 individuals from 6 cohorts (Fig. 1 ).
Five cohorts are from the Netherlands—the Dutch Microbiome Project (DMP; n = 7,955) 12 , Lifelines-DEEP (LLD; n = 1,135, plus 340 followed up after an average of 4 years (designated LLD1 for baseline samples and LLD2 for follow-up samples)) 3 , 13 , the 500-Functional Genomics Project (500FG; n = 529) 14 , 15 , the 1000 Inflammatory Bowel Disease Project (IBD; n = 544) 16 and 300-Obesity (300OB; n = 298) 15 , 17 —and one is from Tanzania (300-Tanzania Functional Genomics Project (300TZFG), n = 320) 18 (Fig.
1 and Supplementary Table 1 ). For LLD2 and 500FG, we have additional datasets from some of the same individuals ( n LLD2 = 251, n FG500 = 459) with samples processed using both DNA extraction methods 19 that allowed us to assess the effect of extraction protocol on SNV profiling and the robustness of microbial genotyping (Fig.
1 , Supplementary Table 1 and Supplementary Note 1 ). The extensive phenotypic information for the corresponding samples was also curated and harmonized. We integrated 244 phenotypic and exposure factors (92 binary and 152 continuous or ordinal traits) available in the DMP or in at least 2 other cohorts for analysis (Fig.
2a and Supplementary Table 2 ). Among these, 131 phenotypes were available for at least 2 cohorts, whereas 113 were only available for the DMP. Across the whole dataset, the sample size per phenotype ranged from 593 to 11,706 (Supplementary Table 2 ).
Fig. 1: Study design and analysis workflow of the gut microbial SNV-MWAS on human phenotypes and environmental exposures. In this study, we integrated whole-genome shotgun sequencing (WGS) data of 11,831 faecal samples from 10,781 individuals from 6 independent cohorts and harmonized 244 phenotype and exposure factors across these cohorts.
Two of the six cohorts, Lifelines-DEEP (LLD) and 500-Functional Genomics (500FG), are represented by multiple datasets. n represents the number of faecal samples. LLD contains 1,135 samples collected at the study baseline time point (LLD1) and 340 samples collected for a subset of individuals at a follow-up time point after 4 years that were processed using two DNA isolation kits: 253 by QIAGEN QIAamp Fast DNA Stool Mini Kit (FSK; represented by circled F) (LLD2-FSK) and 338 using QIAGEN AllPrep DNA/RNA Mini Kit (APK; represented by circled A) (LLD2-APK).
500FG contains 529 samples that were also processed using the two DNA isolation kits: 517 processed using FSK (500FG-FSK) and 471 processed using APK (500FG-APK). To ensure sample independence in our downstream analysis, we used only LLD1 and 500FG-FSK in this analysis, and the additional datasets (LLD2-FSK, LLD2-APK and 500FG-APK) were used only to carry out technical assessments.
We then conducted meta-genotyping for the WGS data from stool samples and generated the gut microbial genotype profile, keeping 12.8 million common biallelic microbial SNVs for the LMM-based SNV-MWAS. SNV-MWAS analyses were conducted separately for the six independent datasets from the six cohorts and then integrated through meta-analysis.
Linkage disequilibrium-based grouping was conducted to extract independent signals, and an LMM-based permutation test was used to screen for robust association signals. To provide functional interpretation of SNV associations, we then carried out protein structural analysis. Created in BioRender; Fu, J. https://biorender.com/c1z5z7y (2026).
Fig. 2: Overview of host phenome and gut microbial SNV data. a , Overview of the 244 phenotype and exposure factors in this study. The proportions of samples with a non-missing value for the corresponding factor in each cohort are shown in the heat map.
Each row represents a factor. Each column represents a cohort. b , Distributions of common SNV numbers of each species in each cohort. The numbers of species included were: DMP, n = 247; LLD1, n = 207; 500FG, n = 256; 300OB, n = 243; IBD, n = 154; and 300TZFG, n = 327.
Inner box plots show summary statistics: the centre line represents the median, the box hinges represent the lower and upper quartiles of the distribution and whiskers extend no further than 1.5× interquartile range from the hinges, and data beyond the end of the whiskers are outliers plotted as individual points. c , Overall proportion of gut microbial SNV effect types.
Source data We genotyped 50,945,657 biallelic SNVs in the core genome of 881 species using GT-Pro 11 , which conducts reference-panel-based SNV detection using k -mer searching and exact matching. The number of SNVs detected in the DMP was higher than in other cohorts, probably owing to its larger sample size (Extended Data Fig.
1a,b ). The total number of SNVs detected in at least 1 sample for each species ranged from 1 to 342,230 (mean = 58,131) (Extended Data Fig. 1c ).
The average density of SNVs in the core genomic region of gut bacteria was 32 SNVs per kilobase pair (Extended Data Fig. 1d ), which is close to previous reports 20 . To keep only informative species for downstream analysis, we selected ‘common’ SNVs that were present in more than 10% of samples and had a minor allele frequency (MAF) of more than 5% in at least one cohort.
Among the 50.95 million SNVs that were detected, 12,761,497 SNVs were common (Supplementary Table 3 ). As the distribution of common SNV counts per species was bimodal, with two peaks separated by approximately 1,000 SNVs (Extended Data Fig. 1e ), we selected species with at least 1,000 common SNVs, resulting in 433 species with 12,706,564 common SNVs (Fig.
2b , Extended Data Fig. 1f,g and Supplementary Table 4 ). These 433 species collectively accounted for, on average, 84.3% (s.d. = 9.4%) of the total abundance of the gut microbial community.
After filtering, 300TZFG had the highest number of species for analysis (327) and the most common SNVs (7,369,266) (Fig. 2b and Extended Data Fig. 1f–h ).
The average density of common SNV sites in the core genomic region of gut bacteria was 16 SNVs per kilobase pair (Extended Data Fig. 1i ). The within-species population structure of the 433 species and the effect of technical factors are described extensively in Supplementary Notes 2 and 3 (Supplementary Figs.
1 – 4 and Supplementary Tables 5 – 8 ). We also pre-calculated the Bonferroni-controlled threshold for study-wide significance by dividing 0.05 by the total number of phenotype–SNV pairs tested (922,497,753), yielding a threshold of 5.42 × 10 −11 ( Methods ). To understand the functional consequences of SNVs, we annotated genes from reference genomes and predicted the potential functional effect of SNVs on bacterial gene products (synonymous, missense, start or stop codon, and non-protein-coding) 21 (Fig.
2c , Extended Data Fig. 2 and Supplementary Table 9 ). Most SNVs (11,819,660, 93.02%) were located in protein-coding regions, including 9,579,907 (75.39%) synonymous, 2,216,969 (17.45%) missense and 22,784 (0.18%) start or stop codon variants (Fig.
2c ). The distribution of the proportion of codon-altering SNVs (missense or start or stop codon SNVs) varied across different bacterial species (Extended Data Fig. 2 ), reflecting the genetic diversity and evolutionary pressures experienced by these species.
Atlas of gut microbial SNV associations We next performed an SNV-MWAS of 244 factors by linking them to 12 million common SNVs using LMMs fitted separately for each species, phenotype and cohort. These LMMs controlled for population structure by including the species-level between-sample genetic linkage matrix as a random effect.
Age, sex, species abundance and clean read count were included as fixed-effect covariates, except in the analyses for age and sex themselves. Given that reference and alternative alleles may coexist within a sample with differing abundances, we encoded gut microbial genotypes as a dosage value ranging from 0 to 1 to represent the frequency of the alternative allele.
Following the per-cohort SNV-MWAS, we conducted a meta-analysis weighted by sample size for the SNV–phenotype pairs available in at least two cohorts to integrate the SNV-MWAS results derived from different cohorts (Fig. 1 ). This included only the independent datasets—that is, excluding LLD2 and 500FG-APK.
This analysis identified 49,346 significant and robust associations that passed the study-wide significance cut-off (meta-analysis P < 5.42 × 10 −11 ; Extended Data Fig. 3 and Methods ) and were supported by at least 2 cohorts based on a permutation-based robustness test (cohort permutation P < 0.05 with 999 permutations), with the same association direction.
These associations involved 39,663 SNVs of 101 species and 69 phenotypes. As a resource for further validation and hypothesis generation, we have constructed a catalogue ( https://fulab.web.rug.nl/SNV-MWAS/ ) that includes all 49,346 robust associations as well as the suggestive signals that passed the species-wide significance level (species-specific, defined by Bonferroni correction based on the number of tested SNVs within each species; Methods ) in the meta-analysis and the largest cohort DMP (see examples in Supplementary Note 4 and Supplementary Fig.
5 ). Most SNV associations (85.76%) were supported by two cohorts, and 14.24% were supported by three or more cohorts (Fig. 3a ).
Although all associated SNVs showed a similar ratio of start or stop codon or missense SNVs (17.49%) compared with the background (all common SNVs), six phenotypes were significantly enriched for start or stop codon or missense SNVs ( χ 2 test P < 0.05): Lifelines protein diet score, on-a-diet behaviour during the past month, thrombocyte count, waist circumference, β-blocker intake and sex (Extended Data Fig.
4 ). SNVs in the non-coding region may affect gene expression through upstream regulators. For example, variants located approximately 10 bp upstream of the start codon may affect the ribosome-binding site or other elements involved in translation initiation, thereby altering bacterial protein expression 22 .
We further examined the distribution patterns of common and phenotype-associated SNVs in gene upstream regions. The common SNV count showed a drop in −10 bp regions (Fig. 3b ), and the ratio of SNVs with at least one association showed an uneven distribution, with a drop at −11 bp and two peaks at −55 bp and −83 bp (Fig.
3c ). Fig. 3: Summary of SNV-MWAS signals. a , Proportion of gut microbial associations in different categories, including association supporting cohort number, species-level association, SNV effect and protein function annotation status. b , Count of SNVs in the −100 bp to −1 bp region upstream of the gene.
The dashed line indicates the drop in SNV count at −10 bp. c , Proportion of SNVs associated with at least one host phenotype in the −100 bp to −1 bp region upstream of the gene. Dashed lines indicate the peaks at −83 bp and −55 bp and the drop at −11 bp. d , Number of independent meta-analysis association signals with gut microbial SNVs for each phenotype.
Association P values were obtained from two-sided LMM tests in each cohort followed by sample size-weighted meta-analysis. Study-wide significance was defined using a Bonferroni-corrected threshold of meta-analysis P < 5.42 × 10 −11 , based on 922,497,753 phenotype–SNV tests. Exact P values for individual association signals are provided in Supplementary Table 10 .
Colours indicate if the abundance of the species corresponding to the signal is associated with the corresponding phenotype. e , Total number and proportion of association signals in which the abundance of the species corresponding to the signal is associated (blue) or not associated (red) with the corresponding phenotype. f , Two-dimensional density plot showing the inverse correlation between MAF and scaled effect size for the 940 independent meta-analysis association signals. g , Heat map showing the proportion of shared association signals between phenotypes.
Only phenotypes that share at least ten signals with another phenotype are shown. The bottom triangle shows the proportion of shared signals between phenotypes, as indicated by colour intensity. The upper triangle shows the number of shared signals between phenotypes.
AAT, α-1-antitrypsin; BA, bile acid; CA, cholic acid; CDCA, chenodeoxycholic acid; DBP, diastolic blood pressure; GCA, glycocholic acid; GCDCA, glycochenodeoxycholic acid; GDCA, glycodeoxycholic acid; GUDCA, glycoursodeoxycholic acid; HCT, haematocrit; HDL, high-density lipoprotein cholesterol; hsCRP, high-sensitivity C-reactive protein; LCMS, liquid chromatography–mass spectrometry; LDL, low-density lipoprotein cholesterol; p, proportion in total BAs; PPI, proton pump inhibitor; SBP, systolic blood pressure; TCA, taurocholic acid; TCDCA, taurochenodeoxycholic acid; TDCA, taurodeoxycholic acid; TG, triglycerides; TUDCA, tauroursodeoxycholic acid; UDCA, ursodeoxycholic acid; WHR, waist-to-hip ratio.
Source data As SNVs can be correlated due to linkage disequilibrium in the genomes, we conducted a grouping analysis to select the most significant SNVs within each linkage disequilibrium block as representative tags of the independent signals (between-SNV r 2 < 0.01; Methods ).
We then identified 940 independent SNV-MWAS signals (Fig. 3d,e and Supplementary Table 10 ) and 13,198 SNVs with a high probability of contribution to phenotypic variation (posterior inclusion probability > 0.8) (Supplementary Note 5 and Supplementary Fig. 6 ).
Power assessment found that 70.5% of signals have more than 0.80 power to be detected given the observed effect size, sample size, and MAF (Supplementary Note 6 and Supplementary Fig. 7 ) and showed a negative correlation between MAF and effect size (Fig. 3f , R = −0.29, P = 6.06 × 10 −20 ).
We also assessed replication across cohorts of different ancestries. Among the 940 signals, 215 had both SNVs and phenotypes available in the Dutch and Tanzanian cohorts, with 161 (74.9%) signals involving 8 different phenotypes supported by both cohorts. For example, 48 association signals of 23 species with age are supported by Dutch and Tanzanian cohorts (Extended Data Fig.
5 ). Notably, among the 940 SNV–phenotype association signals, 65.74% showed no significant associations at the abundance level (linear regression, Bonferroni-corrected meta-analysis P > 0.05; Fig. 3d,e ).
To illustrate the added value of SNV associations, we systematically assessed the phenotypic associations with the gut microbiome at the species abundance, SNV and structural variant levels. Among the 62,464 species–phenotype pairs ( Methods ), 533 showed associations at SNV level, 460 (86.30%) showed associations only at SNV level, and just 5 (0.9%) showed associations at all 3 levels (Extended Data Fig.
6 and Supplementary Tables 11 – 13 ). These results suggest that SNV-based analyses provide complementary information to structural variant- and abundance-based analyses when investigating host–microbiome associations 4 , 5 , 23 . Among 940 signals, 810 were linked with intrinsic factors and 130 with exposure factors (Supplementary Note 7 ).
We found 152 pairwise signal combinations involving 26 intrinsic phenotypes (excluding age, sex and height), in which the same tag SNVs were associated with 1 or more exposure factors (Fig. 3g and Supplementary Table 14 ). To assess whether exposure factors confounded the association signals of the intrinsic factors, we included the exposure factors as covariates in a robust association test using LMM-based permutation tests (999 permutations) for the association signals shared between intrinsic phenotypes and exposure factors.
Owing to data completeness requirements (phenotype, exposure and SNV all had to be observed in at least 100 samples), we could evaluate 66 signals. Of these, 54 (81.8%) remained significant in at least 2 cohorts after controlling for the exposure factors (permutation P < 0.05), suggesting that the exposure factors did not confound the majority of the SNV associations with intrinsic phenotypes.
Age-linked SNVs implicate glutathione transport Age showed the highest number of association signals (99 signals) involving 8,117 SNVs across 42 species (meta-analysis P < 5.42 × 10 −11 ) (Fig. 3d and Supplementary Table 10 ). We next assessed how well microbial SNVs could predict host age ( Methods ).
To this end, we trained a machine learning model in the DMP cohort and evaluated its predictive performance in the other cohorts. The model explained 12.8–42.0% of the variation in age ( R 2 ) in the test datasets (Supplementary Notes 8 and 9 , Supplementary Figs. 8 – 10 and Supplementary Tables 15 and 16 ), suggesting the predictive potential of gut microbial genetics for host age.
The most robust signal was supported by four independent cohorts (meta P < 5.42 × 10 −11 ; Fig. 4a , Extended Data Fig. 7 and Supplementary Table 10 ).
This signal contains five SNVs in the genome of F. prausnitzii _I (species ID: 102274), and their associations were not confounded by other microbial features, including bacterial lineage, species abundance and structural variants (Extended Data Fig. 8 and Supplementary Note 10 ).
Notably, all five age-associated SNVs are missense variants located in the sarA_2 gene (gene ID: 102274_01471). The most significant SNV was 102274_1617247 (effect allele: T, effect allele frequency = 17.38%, β = 4.93, meta-analysis P = 1.00 × 10 −17 ), showing that individuals carrying the T allele were 4.9 ± 0.6 years older (mean ± s.d.) than those without the T allele (Supplementary Table 10 ).
The linkage disequilibrium analysis showed that the lead SNV 102274_1617247 is linked with the other four missense SNVs ( R 2 > 0.2; Fig. 4a,b ) in sarA_2 , and significant signals were detected in all cohorts except 300OB (Fig. 4c,d ).
Notably, all 300OB participants are older than 50 years and show a higher frequency of age-associated alleles compared with the other four Dutch cohorts, which have younger average ages (Extended Data Fig. 9 ). In other words, the age-associated allele in the sarA_2 gene of F. prausnitzii _I was enriched in an older population.
Moreover, replication of the association across the Dutch and Tanzanian cohorts (Fig. 4d ) suggests convergent genetic changes during host ageing in different ethnic groups. Fig.
4: Missense SNVs in the gene encoding a glutathione transporter subunit of F. prausnitzii _I are associated with host age. a , Manhattan plot showing the association between SNVs of F. prausnitzii _I (species ID: 102274) and age. Dot colours indicate the effect type of gut microbial SNVs (blue, synonymous variant; green, missense variant; red, start or stop codon variant; and brown, non-coding region variant).
The horizontal dashed line indicates the cut-off for study-wide significance (LMM, unadjusted meta-analysis P < 5.42 × 10 −11 ). P values were obtained from two-sided LMM tests in each cohort followed by sample size-weighted meta-analysis. b , Expanded view of the signal showing the linkage disequilibrium between SNVs associated with age in the OPP operon of F. prausnitzii _I.
Association P values were calculated as described in a ; no additional multiple-testing correction was applied to the displayed P values. c , Violin plots of the age distribution in samples with and without the age-associated allele of SNV 102274_1617247 (Alt) in different cohorts.
Inner box plots show summary statistics. The centre line represents the median, box hinges represent the lower and upper quartiles of the distribution, whiskers extend no further than 1.5× interquartile range from the hinges, and data beyond the end of the whiskers are outliers plotted as individual points.
Unadjusted P values were calculated using two-sided unpaired t -tests; no adjustment for multiple comparisons was applied. d , Heat map of the significance of the associations between the five missense SNVs and age in independent cohorts. P values were obtained from two-sided LMM tests within each cohort and were not adjusted for multiple comparisons. # P < 5.42 × 10 −11 ; *** P < 0.001; * P < 0.05. e , Predicted protein complex structure of the oligopeptide transporter formed by OppA, OppB, OppC, OppD and OppF.
The figure shows the OPP complex embedded in the cell membrane and the tunnel-like cavity space inside the OPP complex. f , Expanded view of the OppA subunit showing glutathione (orange) and amino acid residues (red) affected by the age-associated missense SNVs. g , In silico molecular docking shows the interaction between glutathione (orange) and amino acid residues (red for Y 343 and blue for others) of SarA_2.
NA, not applicable. Source data The sarA_2 gene is a homologue of the oppA gene, which encodes an oligopeptide-binding lipoprotein with a Tat pathway signal sequence in its N terminus. The protein product of sarA_2 also forms an outer-membrane unit of an ATP-binding cassette (ABC)-type transporter system responsible for the uptake of oligopeptides—the oligopeptide permease (OPP) complex (Fig.
4b ). We thus hypothesized that the age-associated missense SNVs may influence the function of the SarA_2 protein (also known as OppA). To test this, we assembled the OPP complex based on the AlphaFold3 prediction, including the five subunits encoded by sarA , oppB _4 , oppC _4 , oppD _4 and oppF _4 (Fig.
4e ). This structural comparative analysis revealed that the predicted OPP structure is similar to the substrate-binding protein-dependent ABC transporter systems of Mycobacterium tuberculosis H37Rv (Protein Data Bank (PDB): 8JA7 ) 24 and E. coli (PDB: 6CVL ) 25 , supporting the plausibility of the predicted ABC transporter architecture.
The sectional view of the predicted OPP complex structure revealed a tunnel-like cavity, with the OppA subunit acting as a gate for the transportation tunnel (Fig. 4e ). Notably, the age-associated SNVs we identify are located in the cavity of OppA that relates to the tunnel (Fig.
4f ), which suggests that these SNVs may affect the transportation function of the protein complex. To infer the potential ligand of the OPP complex and better understand the underlying age-related changes in transport function, we examined the functional annotations of each subunit of the complex in detail.
The OppF_4 subunit, encoded by the gene 102274_01467, was annotated as a GsiA subunit of the transporter for glutathione, an antioxidant that can prevent the damage caused by oxidative stress for both eukaryotes and prokaryotes. We then compared the protein sequences of OppA, OppB_4, OppC_4, OppD_4 and OppF_4 with 3,239 existing protein sequences of the ABC-type glutathione transport system and found that all 5 subunits match existing protein sequences (E-value < 1 × 10 −10 ; Methods ), indicating that the OPP complex may function as a glutathione transport system.
In silico molecular docking analysis further revealed that glutathione can bind to the pocket region of the OppA protein (Fig. 4g and Extended Data Fig. 10 ).
This suggests that age-associated mutations may affect glutathione uptake efficiency and help F. prausnitzii _I better resist ageing-related oxidative stress in the intestinal environment. Structural properties of missense SNVs Motivated by the structural characterization of age-associated SNVs in sarA_2 , we further systematically depicted the effect of associated SNVs in relation to protein structures.
To this end, we focused on 6,799 associated missense SNVs, which are related to 3,724 proteins. We retrieved high-confidence three-dimensional structures of 2,141 (57.49%) proteins with 3,705 associated missense SNVs from the ESM Metagenomic Atlas 26 and AlphaFoldDB 27 . We then systematically characterized these SNVs in relation to structural properties, including relative solvent accessibility (RSA, how exposed a residue is to a solvent), distance to ligand (DTL, distance from the residue to the nearest predicted pocket centre) and distance to protein–protein interaction interface (DTPPI, distance to the closest residue within a predicted protein–protein interface region) ( Methods ).
We designated SNVs in low-DTPPI regions (DTPPI < 10 Å) or low-DTL regions (DTL < 15 Å) as structurally important 28 , 29 , 30 , 31 , 32 . Out of 3,705 SNVs, 752 (20.3%) were structurally important by these criteria, including 246 and 528 SNVs affecting amino acid residues in low-DTL and low-DTPPI regions, respectively (Fig.
5a and Supplementary Table 17 ). These SNVs were associated with 40 different phenotypes (Fig. 5b,c ).
Fig. 5: Structural properties of associated gut microbial SNVs. a , The DTL, DTPPI and RSA of missense SNVs in association signals. b , c , Number of associated missense SNVs in structurally important regions defined by low DTL (<15 Å) ( b ) or low DTPPI (<10 Å) ( c ). d , Genes containing age-associated missense SNVs.
The x axis shows the minimum DTL of the age-associated SNVs within each gene and the y axis shows the corresponding association significance with age. Dot size indicates the number of age-associated SNVs with low DTL (<15 Å) for each gene. P values were obtained from two-sided LMM tests in each cohort followed by sample size-weighted meta-analysis.
Study-wide significance was assessed using the Bonferroni-corrected threshold meta-analysis P < 5.42 × 10 −11 . e , Genes containing age-associated missense SNVs. The x axis shows the minimum DTPPI of the age-associated SNVs within each gene and the y axis shows the corresponding association significance with age.
Dot size indicates the number of age-associated SNVs with low DTPPI (<10 Å) of each gene. Association P values were calculated as described in d . f , g , Predicted structure of the marR homodimer in cartoon and surface representation with the five residues with zero DTPPI affected by age-associated missense SNVs shown in red. h , Dimeric region (red) of the marR homodimer in cartoon and surface representation. i , Result of in silico alanine scanning mutagenesis analysis on two chains (A and B) of the marR homodimer.
Yellow regions indicate the location of residues with zero DTPPI that are affected by age-associated missense SNVs. Residues in h and dots in i are coloured according to change in binding free energy (ΔΔ G ). Source data Age was associated with 165 structurally important SNVs in 122 genes (Fig.
5d,e ). Among these, 54 were identified to be low-DTL SNVs, including 3 of the 5 missense SNVs in the OPP subunit encoded by sarA_2 . In addition, seven low-DTL SNVs were found to be located near a pocket region of the serpin domain-containing protein (gene ID: 104463_01487) in Vescimonas sp900548615 (Fig.
5d and Supplementary Table 18 ). Previous evidence suggested that microbial serpins can inhibit host serine proteases, thereby affecting many physiological processes, such as inflammatory responses 33 , 34 . Moreover, 114 age-associated SNVs were identified as low-DTPPI SNVs, including 7 SNVs in the Vescimonas sp003539495 gene (gene ID: 102612_00172) encoding an HTH marR-type domain-containing protein located in the protein–protein interaction region (Fig.
5e and Supplementary Table 18 ). The bacterial marR homologues are transcriptional regulators that can regulate the expression of many genes related to oxidative stress response 35 . The marR protein functions as a homodimer, and the age-associated mutations with zero DTPPI we identified were located in the dimerization interface where the two marR monomers directly interact (Fig.
5f,g ). To assess how these SNVs may influence marR dimerization, we performed an in silico alanine scanning mutagenesis analysis, systematically replacing each amino acid residue with alanine and quantifying the changes in binding free energy. The age-associated SNVs were clustered in regions showing substantial shifts in binding affinity in the alanine scan (Fig.
5h,i ), indicating that they may alter marR dimerization and consequently its regulatory activity. Collectively, this structure-informed analysis highlights how integrating protein-level information can pinpoint potential functional consequences of SNVs, thereby facilitating prioritization of variants for experimental validation.
Discussion Over the past decade, genome-wide association studies (GWASs) and metagenomics-based microbiome studies have enhanced our understanding of the roles of host genetics and the symbiotic microbiome in host health. However, the application of GWASs to metagenomic data remains limited.
In this study, we took advantage of the growing number of large-scale, deeply phenotyped cohorts with gut microbial metagenomic sequencing data to conduct a PheWAS on 244 phenotype and exposure factors through a gut microbial SNV-MWAS. This identified 940 independent meta-analysis association signals between SNVs of 101 gut microbial species and 69 human phenotypes and exposures.
All associations are detailed in an online catalogue ( https://fulab.web.rug.nl/SNV-MWAS/ ). To carry out this study, we had to resolve a few technical challenges. First, metagenomic sequencing can result in a high genotype missing rate for low-abundance species when sequencing coverage is insufficient.
Second, construction of a population genetic structure based on metagenomic data, rather than on isolate assemblies, is problematic owing to the possibility of within-species strain mixture within the host individual 20 , 36 , 37 . We thus adapted several solutions to make our work feasible and plausible.
We first filtered out species with insufficient genotype information. We then retained sample pairs with sufficient overlap in SNVs to permit construction of population genetic structure based on kinship. Further, to assess whether a sample was very likely to be dominated by a single main strain within the corresponding species, we adapted the idea of phaseability 37 , 38 to estimate the phased haplotypes on the basis of the distribution of allele frequencies (quasi-phaseability).
We then retained only quasi-phaseable samples that were dominated by a single main strain for the association analysis. Out of 940 study-wide significant signals, 482 (51.3%) carry at least one missense change. It is notable, but perhaps not surprising, that a large proportion of associated bacterial SNVs are located in the coding region but do not alter the protein sequence.
It is already known from human GWASs that most single-nucleotide polymorphisms associated with complex traits and diseases lie in non-coding regions or mark synonymous substitutions 39 , 40 , 41 . These single-nucleotide polymorphisms have been found to be more likely to have regulatory roles in gene expression or to serve as proxies for causal variants.
Although functional exploration of synonymous substitutions in bacterial genomes remains challenging, previous evidence suggests that synonymous changes can themselves affect gene expression or protein folding. Synonymous substitutions have been shown to alter mRNA structures and protein levels 42 , to perturb co-translational protein folding in E. coli 43 , and to influence translational efficiency by altering the secondary structure of mRNA in Salmonella enterica 44 .
Future studies may explore the effect of synonymous SNVs on expression or folding using metatranscriptome or ribosome profiling readouts, along with targeted perturbations in representative isolates. This study provides a catalogue of microbial SNVs associated with various human phenotypes, offering a valuable resource for validation and hypothesis generation.
However, our resource primarily includes samples from the Netherlands, with the DMP cohort supplying nearly three-quarters of samples. This imbalance amplifies the discovery power of the DMP and raises the spectre of winner’s curse inflation in the effect sizes inferred from that cohort alone 45 .
Although we included the Tanzanian cohort to test for replication of associations in a genetically and geographically distant population, its smaller sample size limits the power of the replication analysis. In future, more large-scale cohorts with diverse genetic and lifestyle backgrounds should be integrated to enhance gut microbial SNV-MWAS in a multi-ancestry context, especially including non-European populations 46 .
Moreover, the biological interpretation of these signals currently remains limited. Although we applied structural biology to assess the functional importance of SNVs, we need to take several further key steps to move from association signals to hypotheses. These include identification of causal variants; molecular readouts through metatranscriptomics, metaproteomics and metabolomics; and phenotypic readouts of microorganisms (such as growth rate, biofilm formation and energy utilization).
Looking further ahead, experimental validation will be required to confirm the underlying mechanisms, including approaches such as culturing bacterial isolates with different genetic variants on human induced pluripotent stem cell-based organ-on-a-chip models to assess the effect of bacterial SNVs on human cells 1 , 47 .
Methods Cohort description Dutch Microbiome Project The DMP consists of 8,719 individuals and is part of the Lifelines study, a multi-disciplinary prospective population-based cohort study that utilizes a unique 3-generation design to examine health and health-related behaviours in 167,729 people living in the northern Netherlands.
Lifelines utilizes a broad range of investigative procedures to assess the biomedical, socio-demographic, behavioural, physical and psychological factors that contribute to health and disease, with a special focus on multi-morbidity and complex genetics 48 . Microbiome data generation for the DMP is described in Gacesa et al.
12 . In brief, fresh-frozen faecal samples were collected from participants of the Lifelines cohort. Microbial DNA was isolated using the QIAamp Fast DNA Stool Mini Kit (FSK, Qiagen) by the QIAcube automated sample preparation system (Qiagen).
Metagenomic sequencing was performed at Novogene, China using the Illumina HiSeq 2000 sequencer. Lifelines-DEEP cohort LLD is a sub-cohort of Lifelines that was established to explore the risk factors of complex diseases. In LLD, 1,539 individuals were included, with multi-layers of omics data collected at baseline in 2013 (ref.
13 ). In the current study, high-quality metagenomic sequencing data were available for 1,135 individuals (474 male and 661 female participants). The average age of LLD participants was 45.04 years (18–81 years, s.d. = 13.60 years).
The average BMI was 25.26 kg m −2 (16.67–48.56 kg m −2 , s.d. = 4.18 kg m −2 ). Microbiome data generation for the LLD is described in Zhernakova et al. 49 .
In brief, fresh-frozen faecal samples were collected, and DNA was isolated with the AllPrep DNA/RNA Mini Kit (APK, Qiagen, 80204). Sequencing was performed using the Illumina HiSeq platform at the Broad Institute, Boston. 1,135 metagenomic samples passed quality control.
Follow-up APK samples of LLD were collected for 338 individuals (150 male and 188 female participants) at a second time point. The duration between the two time points ranged from 3.33 to 3.92 years (mean = 3.53 years, s.d. = 0.12 years). At baseline, the mean age of participants was 48.2 years (18–80 years, s.d. = 11.7 years) and their mean BMI was 25.4 kg m −2 (17.6–43.3 kg m −2 , s.d. = 4.08 kg m −2 ).
At follow-up, the mean age was 51.7 years (22–84 years, s.d. = 11.7 years) and the mean BMI was 25.6 kg m −2 (16.1–37.6 kg m −2 , s.d. = 4.0 kg m −2 ). Two aliquots of each stool sample were processed and used for DNA isolation and library preparation using two kits: FSK (Qiagen) and APK (Qiagen, 80204).
WGS was performed on the Illumina HiSeq 2000 platform. 500-Functional Genomics cohort The 500FG is part of the Human Functional Genomics Project (HFGP) and consists of 534 individuals. The average age of 517 500FG-FSK participants was 28.47 years (18–75 years, s.d. = 13.69 years), and the average BMI was 22.75 kg m −2 (15.09–35.43 kg m −2 , s.d. = 2.85 kg m −2 ).
The metagenomic data generation was described previously 14 , 15 . In brief, DNA was isolated from 517 and 471 faecal samples with the FSK (Qiagen) and APK (Qiagen, 80204), and libraries were sequenced on the Illumina HiSeq 2000 platform. 300-Obesity cohort The 300OB cohort was established by Radboud University Medical Center, Nijmegen, the Netherlands 50 .
In total, 298 older individuals with metagenomic data (132 female and 166 male participants) with a high BMI > 27 kg m −2 were enrolled in 300OB. The average age of 300OB participants was 67.07 (54–81 years, s.d. = 5.39 years). The average BMI was 30.73 kg m −2 (26.28–45.47 kg m −2 , s.d. = 3.48 kg m −2 ).
All participants were included between 2014 and 2016. The metagenomic sequencing of faecal samples was done using a similar protocol and analysis pipeline to LLD. 1000 Inflammatory Bowel Disease cohort The 1000 Inflammatory Bowel Disease cohort (1000IBD) consists of patients with IBD recruited at the specialized IBD outpatient clinic of the University Medical Center Groningen (UMCG) in the Netherlands 16 , 51 .
IBD diagnosis was made based on accepted radiological, endoscopic and histopathological evaluation. The 1000IBD cohort is 60.70% female and 39.30% male. The mean age of participants was 42.61 (18–82 years, s.d. = 14.69 years) and their mean BMI was 25.44 kg m −2 (15–49.4 kg m −2 , s.d. = 5.05 kg m −2 ).
300-Tanzania Functional Genomics cohort For analysis among non-Europeans, we included 300TZFG, a population cohort of 323 individuals from both rural and urban areas in the Kilimanjaro region of northern Tanzania. This study is part of the HFGP. Metagenomic data generation was described previously 18 .
In brief, bacterial DNA was isolated using the APK (Qiagen), and libraries were sequenced on the Illumina NovaSeq 6000 platform. The average age of 300TZFG participants with metagenomic data was 33.08 years (17.76–66.43 years, s.d. = 11.25 years). The average BMI was 24.98 kg m −2 (16.41–41.91 kg m −2 , s.d. = 4.93 kg m −2 ).
Quantification of metabolites Bile acid quantification The levels of 15 bile acids and C4 concentrations in fasting plasma were quantified by liquid chromatography–tandem mass spectrometry (LC–MS/MS) procedures, as previously described 52 , 53 . In brief, for sample preparation, 25 μl plasma was mixed with 250 μl internal standard solution to precipitate proteins.
Samples were centrifuged at 15,800 g , and the supernatant poured into a clean glass tube. The fluid was evaporated under nitrogen at 40 °C. Before measuring, samples were reconstituted in 200 μl 50% methanol in water.
For the quantitative determination of bile acids, we used a Nexera X2 Ultra High-Performance Liquid Chromatography system (Shimadzu), coupled to a SCIEX QTRAP 4500 MD triple quadrupole mass spectrometer (SCIEX) (UHPLC–MS/MS). The LC–MS/MS system is controlled by Analyst MD 1.6.2 software.
Bile acids were separated with an ACQUITY UPLC BEH C18 Column (1.7 μm, 2.1 mm × 100 mm) equipped with an ACQUITY UPLC BEH C18 VanGuard Pre-Column (1.7 μm, 2.1 mm × 5 mm) (Waters). Separation was achieved in 28 min using 10 mM ammonium acetate in 20% acetonitrile (mobile phase A) and 10 mM ammonium acetate in 80% acetonitrile (mobile phase B), flow 0.4 ml min −1 .
The proportions of 15 bile acids (with suffix ‘_p’) were calculated by dividing by total bile acid concentration. Additionally, eight different total bile acid concentrations and ratios were calculated: (1) total bile acid (Total_BAs) = sum of all bile acid concentrations; (2) total primary bile acid (Total_primary_BAs) = sum of all primary bile acid concentrations; (3) total secondary bile acid (Total_secondary_BAs) = sum of all secondary bile acid concentrations; (4) ratio of secondary bile acids to primary bile acids (Secondary_primary_ratio) = Total_secondary_BAs/Total_primary_BAs; (5) ratio of CA to CDCA concentrations (CA_CDCA_ratio) = (CA + TCA + GCA)/(CDCA + TCDCA + GCDCA); (6) ratio of unconjugated bile acid to conjugated bile acid concentrations = (CA + CDCA + DCA + LCA)/(TCA + GCA + TCDCA + GCDCA + TDCA + GDCA + TLCA + GLCA); (7) ratio of dehydroxylated CA to deconjugated CA concentrations (CA_dehydro_deconju_ratio) = (DCA + TDCA + GDCA)/(CA + TCA + GCA); and (8) ratio of taurine-conjugated bile acid to glycine-conjugated bile acid concentrations (Taurine_glycine_ratio) = (TCA + TCDCA + TDCA + TLCA)/(GCA + GCDCA + GDCA + GLCA).
Short-chain fatty acid quantification The stool level of short-chain fatty acids was measured using gas chromatography–mass spectrometry, as previously described 54 , 55 . Quantification of trimethylamine N -oxide and its precursors Trimethylamine N -oxide and its precursors betaine, carnitine, deoxycarnitine, and choline were measured using LC–MS/MS, as previously described 56 , 57 .
In brief, an online cleanup of the sample was carried out using an analytic column containing a C 18 stationary phase, prior to its introduction into the mass spectrometer. This stationary phase did not retain the analytes, but it did retain significant matrix interferences, such as (phospho-)lipids 58 .
Untargeted blood metabolome quantification Untargeted metabolic profiling of fasting plasma samples was conducted at General Metabolics using flow-injection–time-of-flight mass spectrometry on an Agilent 6550Q-TOF system, as previously described 59 , 60 , 61 . Quantification of biological age parameters Telomere length measurement Telomere length was assessed using an automated multicolour flow–fluorescence in situ hybridization (Flow-FISH) technique as previously described 62 , 63 .
In brief, white blood cells were obtained by lysing erythrocytes in whole blood with NH 4 Cl. These white blood cells were then combined with bovine thymocytes, which have a known telomere length and serve as an internal reference. The cells underwent denaturation in formamide at 87 °C, followed by hybridization with a fluorescein-labelled (CCCTAA) 3 peptide nucleic acid probe specific to telomere sequences.
They were then counterstained with the DNA dye LDS751. Flow cytometry was used to measure the fluorescence intensity in granulocytes, total lymphocytes, and lymphocyte subsets (identified by antibodies specific for CD20, CD45RA and CD57). This fluorescence intensity, compared to internal control cells and unstained controls, was used to determine the median telomere length from duplicate measurements. sjTREC measurement Signal joint excision circles produced during T cell development (sjTREC) expression was quantified using quantitative PCR (qPCR) as previously described 63 .
In brief, DNA was extracted from whole blood using proteinase K digestion, phenol extraction, and isopropanol precipitation. We then used TaqMan qPCR on a ViiA 7 system (Life Technologies) to quantify sjTREC expression. The qPCR was performed on 75–100 ng of DNA in a 12 μl reaction mix with 18 μM of sjTREC primers (5′-TCGTGAGAACGGTGAATGAAG-3′ and 5′-CCATGCTGACACCTCTGGTT-3′) and albumin primers (5′-TGAACAGGCGACCATGCTT-3′ and 5′-CTCTCCTTCTCAGAAAGTGTGCATAT-3′) and 5 μM probes for sjTREC (5′-(FAM) CACGGTGATGCATAGGCACCTGC-3′ (TAMRA)) and albumin (5′-(FAM) TGCTGAAACATTCACCTTCCATGCAGA -3′ (TAMRA)).
The PCR protocol was 50 °C for 2 min, 95 °C for 15 min, followed by 45 cycles of 95 °C for 15 s and 60 °C for 30 s. Reactions were done in duplicate. Fluorescence from probe cleavage was measured at the threshold cycle ( C T ).
Valid results had a duplicate s.d. ≤ 1. Normalized sjTREC expression was calculated from the difference between average C T values of albumin and sjTREC.
Metagenomic sequencing and quality control We removed host genome-contaminated reads and low-quality reads from the raw metagenomic sequencing data using KneadData (v0.7.4), Bowtie2 (v2.3.4.3) 64 and Trimmomatic (v0.39) 65 . In brief, the data-cleaning procedure includes two main steps: (1) filtering out human genome-contaminated reads by aligning raw reads to the human reference genome (GRCh37–hg19) and (2) removing adaptor sequences and low-quality reads using Trimmomatic with default settings (SLIDINGWINDOW:4:20 MINLEN:50).
Quantification of reference genome abundance We estimated the abundances of reference genomes in metagenomic samples using CoverM (v0.7.0) 66 based on the identical reference genomes used in metagenomic SNV detection. Metagenomic structural variant detection Structural variants were defined as within-species highly variable genomic fragments (>1 kb) across microbial genomes.
Structural variants of the gut microbiome were detected from cleaned metagenomic reads using SGVFinder (v2.0) 4 based on the identical reference genomes used by metagenomic SNV detection. Metagenomic SNV detection We characterized the SNVs for metagenomic samples using GT-Pro (v1.0.1) based on the pre-constructed sck-mer database 11 .
In brief, a catalogue of 104 million biallelic SNVs in the core genomic region of 909 gut microbial species was initially constructed based on Unified Human Gastrointestinal Genome (UHGG) assemblies, the genotypes of the gut microbial SNVs were tagged by species-specific k -mers, and a k -mer-based gut microbiome metagenomic SNV panel was constructed.
GT-Pro directly conducted genotyping for gut microbiota from metagenomic sequencing data by k -mer-searching and matching the genotype k -mers of the metagenomic SNV panel. GT-Pro output was further converted to SNV dosage format, with genotype indicating the frequency of the alternative allele.
Quality control of the SNV profile We calculated allele frequencies based explicitly on the average reference or alternative allele proportions across samples: For a given SNV across n samples, let: R i = relative abundance (proportion) of the reference allele in sample i (for example, 0.7) A i = relative abundance (proportion) of the alternative allele in sample i (for example, 0.3) These values typically sum to 1 per sample if only two alleles are considered.
Then: Reference allele frequency (RAF): $$\mathrm{RAF}=\frac{\mathop{\sum }\limits_{i=1}^{N}{R}_{i}}{N}$$ Alternative allele frequency (AAF): $$\mathrm{AAF}=\frac{\mathop{\sum }\limits_{i={1}}^{N}{A}_{i}}{N}\,\mathrm{or}\,\mathrm{AAF}=1-\mathrm{RAF}$$ MAF: $$\mathrm{MAF}=\min (\mathrm{RAF},\mathrm{AAF})$$ We then performed quality control in each cohort separately, filtering out SNVs with a high missing rate (>90%) or low MAF (<0.05) to get the cohort-specific common SNVs.
We next counted the number of SNVs retained for each species in each cohort and removed species with a low common SNV number (<1,000). The manipulation and quality control of genotype datasets were conducted using PLINK2 (v2.0.0-a.6.9LM) 67 . Annotation of microbial genes and SNVs The genes of gut microbial reference genomes were predicted and annotated using Bakta 68 (v1.10.1, database v5.1).
The functional effects of the common SNVs were annotated using SnpEff (v5.1f) 21 . Between-sample genetic relatedness and population genetic structure For each species, we calculated the species-specific between-sample genetic dissimilarity D i , j measured by a Manhattan distance scaled by the number of shared SNVs within each sample pair using the parallelDist() function in R package parallelDist (v0.2.6).
Sample pairs sharing <1,000 SNVs were skipped for the genetic dissimilarity calculation, and the corresponding D i , j were marked as missing values. To maximize the size of the retained sample with no missing value, we removed the sample with the highest number of missing values from the matrix in each round until there are no missing values in the matrix.
We further calculated the between-sample genetic relatedness, R i , j = 1 – D i, j , and the matrix M R containing R i, j was used as the representative of population genetic structure. We performed principal coordinate analysis on the genetic dissimilarity matrices M D using the pcoa() function from R package ape (v5.7-1) with the parameter correction = “cailliez”.
Linkage disequilibrium calculation To depict the linkage disequilibrium (LD) structure overview of each species, we randomly extracted 1,000 SNVs from the cleaned genotype dataset using plink2 (v2.0.0-a.6.9LM) with the parameters -thin-count 1000. We then calculated the LD as a squared correlation for all pairs of extracted SNVs using plink2 with the parameters -r2 inter-chr yes-really -ld-window-r2 0.
We visualized the whole-genome LD structure using LDBlockShow (v1.40) 69 with the parameters -SeleVar 2 -NoShowLDist 100000000 -OutPdf -OutPng. Quasi-phaseability assessment The co-existence of multiple strains of a species within the host may bias the position of the sample in the population genetic structure and decrease the power of association analysis.
For a given species, samples in which > 80% of the SNVs have the same allele in > 90% of the reads were considered quasi-phaseable, meaning the sample is very likely to be dominated by one strain of the corresponding species. The criterion and concept of quasi-phaseability were described before 38 , 70 .
SNV-based metagenome-wide association study and meta-analysis We first manually integrated and curated the phenotypes from different cohorts and datasets to ensure the consistency of units. Each phenotype was analysed with a LMM that contained: (1) fixed effects for corresponding species abundance, age, sex and sequencing depth, and (2) a random-effect term capturing within-species population structure, with the variance–covariance of this random effect specified by the sample-by-sample kinship matrix ( M R ).
When sex or age was the trait analysed, that variable was omitted from the covariate list. The LMM-based analysis was conducted using EMMAX (version beta-07Mar2010) 71 with the parameters emmax -d 10 -t genotype.file -p phenotype.file -c covariate.file -k kinship.file -o output -Z.
The association analyses were performed for each cohort and each species separately, with only the quasi-phaseable samples of the corresponding species included for the association analysis. For the SNV–phenotype pairs available in two or more independent cohorts (DMP, LLD1, 500FG, 300OB, IBD and 300TZFG), a follow-up meta-analysis was performed in the independent datasets (excluding the LLD2 and 500FG-APK datasets) using the Metal software (v2020-05-05) 72 with default options (weighting cohort-based P values according to sample size).
To ensure robustness and further reduce the chances of false discovery of identified associations, we conducted a permutational LMM with 999 times permutation following the Monte Carlo procedure within each cohort to assess the robustness of significant associations. Regional association plots showing LD structures on the gene regions covering the association signals were generated using LDBlockShow (v1.40) 69 .
Determination of significance cut-off The threshold of study-wide significance was determined by the total number of tested phenotype–SNV pairs (922,497,753) using the Bonferroni method: 0.05/no. of phenotype–SNV pairs = 5.42 × 10 −11 . Similarly, suggestive significance was determined using Bonferroni correction based on the total number of tested SNVs in each species and for each phenotype.
Thus the suggestive significance did not control for the number of species and phenotypes involved in the study. Linkage disequilibrium-based grouping The SNVs could be correlated due to LD in the genomes. To count the number of independent association signals, we further conducted a grouping analysis that grouped interrelated SNVs by LD and picked the most significant SNVs within each LD block as representatives or tags of the independent signals (between-SNV r 2 > 0.01, window size = 10,000 kbp) using PLINK2 (v2.0.0-a.6.9LM) 67 .
The primary and secondary significance cut-offs used in PLINK2 were study-wide significance (5.42 × 10 −11 ) and species-wide significance (species-specific) cut-offs. We visualized the local LD structure using LDBlockShow (v1.40) 69 with the parameters -SeleVar 2 -NoShowLDist 100000000 -OutPdf -OutPng.
Power analysis We performed a post-hoc approximate power analysis for the tag SNVs of significant associations using the genpwr package (v1.0.4) in R. The proportion of phenotypic variance explained ( R 2 ) was estimated from the observed effect size, standard error, observed sample size and MAF using the pheno_var_explained() function.
Power was then calculated with power.calc.linear() under an additive genetic model and a study-wide significance threshold of α = 5.42 × 10 −11 . To evaluate the effect of sample size, power was also computed across fixed sample sizes ( n = 100, 500, 1,000, 5,000 and 10,000) for the tag SNVs of significant associations.
Protein 3D structure prediction and protein structure-based analysis As AlphaFold3 supports structure prediction for protein complexes, the three-dimensional (3D) structures of the OPP complex were modelled using AlphaFold3 (ref. 73 ) and visualized in ChimeraX (v1.10.1) 74 and PyMOL (v2.5.7).
However, according to the terms of use of the AlphaFold3 server, its output cannot be used in docking or screening tools ( https://alphafoldserver.com/about ). We therefore used local AlphaFold2 for monomer protein structure prediction and conducted in silico docking and other downstream analyses.
To explore interactions between OppA/SarA_2 and glutathione, the protein structure of OppA/SarA_2 was first predicted using AlphaFold2 (v2.3.1) 75 for both the wild-type and mutated protein sequences under monomer settings. The default reference databases and a template cut-off date of 14 May 2020 were used to guide the structure generation.
For each experiment, five models were produced and further refined using graphics processing unit-based AMBER relaxation. The best model, based on pLDDT confidence scores (mean ≥ 90), was selected for downstream analysis, excluding the low-confidence N-terminal residues. The glutathione structure was downloaded from PubChem ( https://pubchem.ncbi.nlm.nih.gov/ ) and converted into PDB format.
Ligand-binding pockets in the OppA/SarA_2 structure were predicted using P2Rank (v2.5) 76 , focusing on residues with high ligand-binding probabilities (>0.6) from top-scoring pockets (probability > 0.85). These residues were then used as active sites in HADDOCK (v2.4) 77 , 78 , a docking platform that generated 200 structural complexes for each variant.
The top four docked poses from the best-scoring cluster were selected and energy-minimized in water. Binding free energies (Δ G ) were estimated using PRODIGY-LIG (v1.1.4) 79 , 80 , and PLIP (v2025) 81 was used to identify non-covalent interactions. As a docking benchmark, a literature-derived 82 , 83 tripeptide panel representing basic (KAK, KWK, KKK), neutral (AAA, GFG, GAG) and acidic (EEE, DED) chemistries was docked to the same OppA binding site using the same set of active residues defined for the glutathione docking in HPEPDOCK (v2.0) 84 .
All the resulting complexes were refined through water minimization in HADDOCK (v2.4) 77 , and binding free energies were estimated with PRODIGY-LIG (v1.1.4) 79 . The protein structural property analysis was conducted using an internal pipeline ( https://github.com/GArcho44/snvs-annotation-pipeline ).
In brief, to interpret effect of SNVs at the protein structure level, only missense variants in coding regions were retained. Functional gene annotations from Bakta (v1.10.1) 68 and UniProt ( https://www.uniprot.org/ ) 85 , 86 enabled linkage of genes to protein sequences within UniRef100 and consequently to structure entries in the AlphaFold Database (AlphaFoldDB, v2022) 27 .
Recognizing that many genes lacked direct matches in UniRef100, we applied a homology-based approach to expand structural coverage. Gene coding sequences were extracted using GffRead (v0.12.7) 87 and translated to proteins with EMBOSS transeq (v6.6.0) 88 . The resulting sequences were queried against AlphaFoldDB and ESM Metagenomic Atlas (version 1 November 2022, https://esmatlas.com/ ) 26 using DIAMOND BLASTP (v2.0.15) 89 , retaining only full-length matches with ≥98% identity.
When multiple matches occurred, the best match was selected by identity score, preferring AlphaFoldDB entries when there was a tie. Protein accessions (UniProtKB or MGnify) were then used to retrieve high-confidence structural models (mean pLDDT ≥80) via custom application programming interfaces.
Multiple per-residue properties were measured on these curated protein models to functionally annotate the structural properties of SNVs. Relative solvent accessibility (RSA) was calculated using DSSP (v3.0.0) 90 , 91 , normalizing surface exposure per residue against empirical maxima.
Ligand-binding pockets were detected using fpocket (v4.2.1) 92 and rescored with fpocket PRANK to boost detection sensitivity. Binding residues were defined from pockets with druggability score > 0.5. Each residue’s distance to ligand (DTL) was computed based on the minimal Euclidean distance to the closest pocket centre.
Protein–protein interaction interfaces were predicted using PeSTo (model version i_v4_1) 93 . Residues with interface confidence scores > 0.5 were grouped into clusters based on spatial proximity (Cα–Cα < 10 Å), and only high-confidence clusters (average score > 0.8, pLDDT > 0.7 and ≥6 residues) were retained.
Each residue’s distance to protein-protein interface (DTPPI) was calculated based on Euclidean distance to closest residue of predicted interface. The 3D structure of the marR homologue dimer was modelled using AlphaFold3 (ref. 73 ) and visualized with ChimeraX (v1.10.1) 74 .
Protein-protein interface analysis, specifically in silico alanine scanning, was performed using the mCSM-PPI2 web server 94 . Identification and annotation of glutathione transport system gene cluster The original gene annotation was conducted using Prokka (v1.13.3) 95 , and the age-association signal was identified in the gene annotated as sarA (UniProtKB: P31306 ), which is located next to oppB , oppC , oppD and oppF .
The sarA gene encodes a periplasmic oligopeptide-binding protein, SarA, and contains an oppA gene family domain. According to the literature 96 , 97 , OppABCDF is a typical oligopeptide permease (OPP) or ABC transport system complex. Therefore, sarA , oppB , oppC , oppD , and oppF could form a gene cluster whose products can assemble into an oligopeptide ABC-transport system complex.
To confirm whether the gene organization of these five genes is conserved as a gene cluster across different bacterial genomes within the F. prausnitzii taxonomic clade, we conducted a gene cluster search using cblaster (v1.3.20) 98 in 17,496 assemblies of F. prausnitzii from publicly available databases such as UHGG (v2.0.2) 99 , SPIRE 100 , and our in-house F. prausnitzii MAG and isolate genomes 6 .
We found that all 5 genes co-occur in 2,185 F. prausnitzii genomes, situated close to each other (maximum distance between any 2 hits in a cluster <20 kb). The F. prausnitzii species with the complete OPP operon are Faecalibacterium butyricigenerans (223), Faecalibacterium duncaniae (3), Faecalibacterium longum (1,568), F. prausnitzii _I (372), Faecalibacterium sp900539945 (1), Faecalibacterium sp934514285 (15) and 3 unclassified genomes.
Therefore, the SarA gene and the other four genes ( oppB , oppC , oppD and oppF ) do form a gene cluster or operon that is conserved in its gene organization within the F. prausnitzii genome. We also conducted 3D structure prediction using AlphaFold3 for the protein complex, compared it to the experimentally derived structures, and found that the predicted structure is similar to experimentally validated ABC transporter structures in M. tuberculosis (PDB: 8JA7 ) 24 and E. coli MetNI (PDB: 6CVL ) 25 .
Therefore, the SarA with the OppA domain can function as OppA and can assemble with the other four subunits to form an OPP complex. To further identify the potential ligand of this OPP complex, we conducted gene function annotation with Bakta (v1.11.0) 68 . We found that one of the five genes in the OPP gene cluster was annotated as an ABC-type glutathione transport system ATPase component ( gsiA ).
We then compared the protein sequences of SarA (OppA), OppB, OppC, OppD and OppF to 3,239 existing protein sequences of the ABC-type glutathione transport system using blastp (v2.16.0 + ). We found that all five proteins match existing protein sequences of the ABC-type glutathione transport system (E-value < 1.00 × 10 −10 ).
The OPP complex may therefore function as a glutathione transport system. Identification of nicotine degradation genes To identify the genes from reference genomes potentially related to nicotine degradation, we obtained sequences of 92 proteins involved in two nicotine-degradation pathways from the Kyoto Encyclopedia of Genes and Genomes (KEGG) (KEGG entries: M00810 and M00811 ) and searched for them in the genes of 909 reference genomes using tblastn (v2.14.1-gompi-2023a) 101 .
In total, we identified 2,434 genes similar to known nicotine-degradation genes (E-value < 1.00 × 10 −10 ). Gut microbial SNV-based age prediction model We constructed a host age prediction model based on light gradient-boosting machine implemented in the R package lightgbm (v3.3.5).
To ensure generalizability of the model, we used tidymodels (v1.1.0) to conduct nested cross-validation with a five-times-fivefold split for the outer loop and a fivefold split for the inner loop to assess the predictive power of gut microbial SNVs on host age. To avoid information leakage for the samples collected from individuals with close microbiome kinship, samples from the same lineage group were assigned to the same split dataset (either internal train dataset or internal test dataset) using the group_vfold_cv() function during the nested cross-validation procedure.
We defined lineage groups using all SNVs used for age model training, pooled across species. Pairwise sample distances (scaled Manhattan distance) D were computed, and kinship was then defined as K = 1 – D . From D = 1 – K , we built a neighbour-joining tree and rooted it to orient the cut.
Lineage groups were assigned by a single tree-height cut at h = (1 – c )/2 with kinship cut-off c = 0.9 (thus h = 0.05, equivalent to distance cut-off 0.1). Each descendant clade crossing this cut was then treated as one lineage group. In all cross-validation runs, we used a set of predetermined hyperparameters: trees = 2000, tree_depth = 15, min_n = 30, sample_size = 0.6, mtry = round(0.2 * total_feature_number), and learning_rate = 0.01.
We estimated the importance of features using Shapley additive explanation, which assigns each feature an importance value for a particular prediction. After 5 × 5 rounds of fivefold cross-validation, we calculated the median importance value of each SNV feature, sorted the SNV features from high to low median importance values, cumulatively summed the median importance values until we reached 95% of the total sum of importance values, and took the counted SNV features as the predictive features for the final model.
Because lineage groups were defined using SNVs pooled across species, this approach captures overall microbiome kinship but may not fully prevent information leakage for individual species whose species-specific kinship structure differs from the overall pattern. Partial correlation analysis The partial correlation test was conducted using the pcor() function of R package ppcor (v1.1).
For the partial correlations between gut microbial SNV age and other biological age indices and between gut microbial SNV age and host intrinsic phenotypes, we used partial Spearman’s correlation, adjusting for chronological age. For the partial correlations between gut microbial SNV age and untargeted blood metabolome, we used a partial Pearson correlation, adjusting for chronological age, sex and blood creatinine level.
Ethical approval The Lifelines study was approved by the Ethics Committee of the UMCG (METc 2007/152). All participants signed an informed consent form prior to enrolment. Additional written consents were signed by the DMP participants or legal representatives for children aged under 18 years.
The LLD study was approved by the Institutional Ethics Review Board of the UMCG (ref. M12.113965), the Netherlands. The 300OB study was approved by the Institutional Review Board (IRB) CMO Regio Arnhem-Nijmegen (nr.
46846.091.13). The 500FG study was approved by the Ethical Committee of Radboud University Nijmegen (NL42561.091.12, 2012/550). The inclusion of volunteers and experiments was conducted according to the principles expressed in the Declaration of Helsinki.
All volunteers provided written informed consent before any materials were collected. The 1000IBD study was approved by the IRB of the UMCG, Groningen (ref. M12.1139652008.338), the Netherlands.
The 300TZFG study was approved by the Ethics Committee of the KCMC University (KURERC) (No. 936) and the National Institute for Medical Research (NIMR/HQ/R.8a/Vol. IX/2290) in Tanzania.
Reporting summary Further information on research design is available in the Nature Portfolio Reporting Summary linked to this article. Data availability The raw metagenomic sequencing data used in this study are available as follows. The Dutch Microbiome Project (DMP; accession EGAS00001005027 ), Lifelines-DEEP (LLD; EGAD00001001991 ), 300-Obesity (300OB; EGAD00001005083 ), and 1000 Inflammatory Bowel Disease Project (1000IBD; EGAD00001004194 ) datasets are deposited at the European Genome–Phenome Archive (EGA; https://ega-archive.org/ ).
Note that access for scientific research is available free of charge, subject to compliance with the applicable informed consent requirements. The 500-Functional Genomics Project (500FG) metagenomic data are publicly available from the NCBI Sequence Read Archive under BioProject PRJNA319574 , and the 300-Tanzania Functional Genomics Project (300TZFG) metagenomic data are publicly available from NCBI under BioProject PRJNA686265 .
To protect participant privacy and comply with the research agreements specified in the informed consent, individual-level participant metadata from DMP and LLD are only available upon request through the LifeLines Biobank and for scientific research purposes. A detailed description of the available metadata can be found in the LifeLines data catalogue: https://data-catalogue.lifelines.nl/ .
Access to LifeLines metadata is subject to a separate application procedure and associated fees (see https://www.lifelines-biobank.com/researchers/working-with-us ). Once a data access application is submitted, the LifeLines Research Office will make a decision within 3 weeks. If the application is approved, LifeLines prepare a Data Transfer Agreement and a corresponding quotation.
Although the LifeLines dataset itself is free of charge, LifeLines apply a usage-based, modular fee model for secure access to research data. Further information on the application procedure, terms of access and current fees is available at https://www.lifelines-biobank.com/researchers/working-with-us and https://www.lifelines-biobank.com/researchers/what-we-offer/fees-2026 , or by contacting research@lifelines.nl.
Clinical phenotype data for the 1000IBD cohort are available through controlled access at EGA under accession EGAD00001003991 and are governed by the 1000IBD Data Access Committee ( EGAC00001000791 ). The phenotype data used in this study for the 500FG cohort are available through the Human Functional Genomics Project portal ( https://hfgp.bbmri.nl/ ).
The phenotype data used for the 300OB cohort are publicly available from Mendeley Data ( https://data.mendeley.com/datasets/4tb8spry4b/1 ; https://doi.org/10.17632/4tb8spry4b.1 (ref. 102 )). The phenotype data used for the 300TZFG cohort are publicly available in supplementary data 1 and 2 of the corresponding published study 18 .
These metadata are publicly available and not subject to restrictions on scientific data use. The dataset underlying the SNV-MWAS catalogue generated in this study is publicly available at Zenodo ( https://doi.org/10.5281/zenodo.22759492 (ref. 103 )) and can also be browsed through the SNV-MWAS catalogue ( https://fulab.web.rug.nl/SNV-MWAS/ ).
Publicly available reference datasets and databases used in this study include the human reference genome GRCh37.p13–hg19 (INSDC assembly accession GCA_000001405.14 ); the GT-Pro gut microbial SNV and species-specific k -mer reference database ( https://github.com/zjshi/gt-pro ); the Unified Human Gastrointestinal Genome catalogue (UHGG v2.0.2; ENA study accession ERP116715 ); the Bakta database v5.1 ( https://doi.org/10.5281/zenodo.10522951 (ref.
104 )); UniProtKB and UniRef100 ( https://www.uniprot.org/ ); MGnify ( https://www.ebi.ac.uk/metagenomics/ ); the AlphaFold Protein Structure Database ( https://alphafold.ebi.ac.uk/ ); and the ESM Metagenomic Atlas, November 2022 release ( https://esmatlas.com/ ). The glutathione structure used for molecular docking was obtained from PubChem (CID 124886 ).
Experimentally determined transporter structures used for structural comparison were obtained from the Protein Data Bank (PDB IDs 8JA7 and 6CVL ). Faecalibacterium genome assemblies used for gene cluster analysis were obtained from UHGG v2.0.2, SPIRE ( https://spire.embl.de/ ), and previously generated bacterial genomes deposited under NCBI BioProject PRJNA1024432 .
KEGG was used to obtain reference protein sequences for pathway-based homology analyses, including nicotine-degradation modules M00810 and M00811 ( https://www.kegg.jp/ ). Source data are provided with this paper. References Peng, H., Ruiz-Moreno, A.
J. & Fu, J. Multi-dimensional metagenomics. Nat.
Rev. Bioeng. 3 , 1057–1072 (2025).
Article CAS Google Scholar Hou, K. et al. Microbiota in health and diseases. Signal Transduct.
Target. Ther. 7 , 135 (2022).
Article PubMed Central PubMed Google Scholar Chen, L. et al. The long-term genetic stability and individual specificity of the human gut microbiome. Cell 184 , 2302–2315.e12 (2021).
Article CAS PubMed Google Scholar Zeevi, D. et al. Structural variation in the gut microbiome associates with host health. Nature 568 , 43–48 (2019).
Article CAS PubMed Google Scholar Wang, D. et al. Characterization of gut microbial structural variations as determinants of human bile acid metabolism. Cell Host Microbe 29 , 1802–1814.e5 (2021).
Article CAS PubMed Google Scholar Zhernakova, D. V. et al. Host genetic regulation of human gut microbial structural variation.
Nature 625 , 813–821 (2024). Article PubMed Central CAS PubMed Google Scholar Zou, D. et al. A SNP of bacterial blc disturbs gut lysophospholipid homeostasis and induces inflammation through epithelial barrier disruption. eBioMedicine 52 , 102652 (2020).
Article PubMed Central PubMed Google Scholar Sharafutdinov, I. et al. A single-nucleotide polymorphism in Helicobacter pylori promotes gastric cancer development. Cell Host Microbe 31 , 1345–1358.e6 (2023).
Article CAS PubMed Google Scholar Chen, Y. et al. Gut metagenomes of type 2 diabetic patients have characteristic single-nucleotide polymorphism distribution in Bacteroides coprocola . Microbiome 5 , 15 (2017).
Article PubMed Central PubMed Google Scholar Zahavi, L. et al. Bacterial SNPs in the human gut microbiome associate with host BMI. Nat.
Med. 29 , 2785–2792 (2023). Article PubMed Central CAS PubMed Google Scholar Shi, Z.
J., Dimitrov, B., Zhao, C., Nayfach, S. & Pollard, K. S. Fast and accurate metagenotyping of the human gut microbiome with GT-Pro.
Nat. Biotechnol. 40 , 507–516 (2022).
Article CAS PubMed Google Scholar Gacesa, R. et al. Environmental factors shaping the gut microbiome in a Dutch population. Nature 604 , 732–739 (2022).
Article CAS PubMed Google Scholar Tigchelaar, E. F. et al. Cohort profile: LifeLines DEEP, a prospective, general population cohort study in the northern Netherlands: study design and baseline characteristics.
BMJ Open 5 , e006772 (2015). Article PubMed Central PubMed Google Scholar Schirmer, M. et al. Linking the human gut microbiome to inflammatory cytokine production capacity.
Cell 167 , 1125–1136.e8 (2016). Article PubMed Central CAS PubMed Google Scholar Horst et al. Host and environmental factors influencing individual human cytokine responses.
Cell 167 , 1111–1124.e13 (2016). Article PubMed Central PubMed Google Scholar Imhann, F. et al. The 1000IBD project: multi-omics data of 1000 inflammatory bowel disease patients; data release 1.
BMC Gastroenterol. 19 , 5 (2019). Article PubMed Central PubMed Google Scholar Kurilshikov, A. et al.
Gut microbial associations to plasma metabolites linked to cardiovascular phenotypes and risk. Circ. Res.
124 , 1808–1820 (2019). Article CAS PubMed Google Scholar Stražar, M. et al. Gut microbiome-mediated metabolism effects on immunity in rural and urban African populations.
Nat. Commun. 12 , 4845 (2021).
Article PubMed Central PubMed Google Scholar Fernández-Pato, A. et al. Choice of DNA extraction method affects stool microbiome recovery and subsequent phenotypic association analyses. Sci.
Rep. 14 , 3911 (2024). Article PubMed Central PubMed Google Scholar Truong, D.
T., Tett, A., Pasolli, E., Huttenhower, C. & Segata, N. Microbial strain-level population structure and genetic diversity from metagenomes. Genome Res.
27 , 626–638 (2017). Article PubMed Central CAS PubMed Google Scholar Cingolani, P. et al. A program for annotating and predicting the effects of single nucleotide polymorphisms, SnpEff.
Fly 6 , 80–92 (2012). Article PubMed Central CAS PubMed Google Scholar Omotajo, D., Tate, T., Cho, H. & Choudhary, M. Distribution and diversity of ribosome binding sites in prokaryotic genomes.
BMC Genomics 16 , 604 (2015). Article PubMed Central PubMed Google Scholar Piccinno, G. et al. Pooled analysis of 3,741 stool metagenomes from 18 cohorts for cross-stage and strain-level reproducible microbial biomarkers of colorectal cancer.
Nat. Med. 31 , 2416–2429 (2025).
Article PubMed Central CAS PubMed Google Scholar Liang, J. et al. Molecular recognition of trehalose and trehalose analogues by Mycobacterium tuberculosis LpqY-SugABC. Proc.
Natl Acad. Sci. USA 120 , e2307625120 (2023).
Article PubMed Central CAS PubMed Google Scholar Nguyen, P. T., Lai, J. Y., Lee, A.
T., Kaiser, J. T. & Rees, D. C.
Noncanonical role for the binding protein in substrate uptake by the MetNI methionine ATP binding cassette (ABC) transporter. Proc. Natl Acad.
Sci. USA 115 , E10596–E10604 (2018). Article PubMed Central CAS PubMed Google Scholar Lin, Z. et al.
Evolutionary-scale prediction of atomic-level protein structure with a language model. Science 379 , 1123–1130 (2023). Article MathSciNet CAS PubMed Google Scholar Fleming, J. et al.
AlphaFold protein structure database and 3D-Beacons: new data and capabilities. J. Mol.
Biol. 437 , 168967 (2025). Article CAS PubMed Google Scholar Zacharias, M.
Match_Motif: a rapid computational tool to assist in protein–protein interaction design. Protein Sci. 31 , 147–157 (2022).
Article CAS PubMed Google Scholar Moal, I. H. & Fernández-Recio, J. SKEMPI: a Structural Kinetic and Energetic database of Mutant Protein Interactions and its use in empirical models.
Bioinformatics 28 , 2600–2607 (2012). Article CAS PubMed Google Scholar Carpenter, K. A. & Altman, R.
B. Databases of ligand-binding pockets and protein-ligand interactions. Comput.
Struct. Biotechnol. J.
23 , 1320–1338 (2024). Article PubMed Central CAS PubMed Google Scholar Markin, C. J. et al.
Revealing enzyme functional architecture via high-throughput microfluidic enzyme kinetics. Science 373 , eabf8761 (2021). Rekand, I.
H. & Brenk, R. DrugPred_RNA–a tool for structure-based druggability predictions for RNA binding sites. J.
Chem. Inf. Model.
61 , 4068–4081 (2021). Article PubMed Central CAS PubMed Google Scholar Mkaouar, H. et al. Siropins, novel serine protease inhibitors from gut microbiota acting on human proteases involved in inflammatory bowel diseases.
Microb. Cell Factories 15 , 201 (2016). Article Google Scholar Mkaouar, H. et al.
Gut serpinome: emerging evidence in IBD. Int. J.
Mol. Sci. 22 , 6088 (2021).
Article PubMed Central CAS PubMed Google Scholar Ariza, R. R., Cohen, S. P., Bachhawat, N., Levy, S.
B. & Demple, B. Repressor mutations in the marRAB operon that activate oxidative stress genes and multiple antibiotic resistance in Escherichia coli . J.
Bacteriol. 176 , 143–148 (1994). Article PubMed Central CAS PubMed Google Scholar Zhao, C., Shi, Z.
J. & Pollard, K. S. Pitfalls of genotyping microbial communities with rapidly growing genome collections.
Cell Syst. 14 , 160–176.e3 (2023). Article PubMed Central PubMed Google Scholar Garud, N.
R., Good, B. H., Hallatschek, O. & Pollard, K. S.
Evolutionary dynamics of bacteria in the gut microbiome within and across hosts. PLoS Biol. 17 , e3000102 (2019).
Article PubMed Central PubMed Google Scholar Rossum, T. V. et al. metaSNV v2: detection of SNVs and subspecies in prokaryotic metagenomes. Bioinformatics 38 , 1162–1164 (2021).
Article Google Scholar Chen, R., Davydov, E. V., Sirota, M. & Butte, A. J.
Non-synonymous and synonymous coding SNPs show similar likelihood and effect size of human disease association. PLoS ONE 5 , e13574 (2010). Article PubMed Central PubMed Google Scholar Sauna, Z.
E. & Kimchi-Sarfaty, C. Understanding the contribution of synonymous mutations to human disease. Nat.
Rev. Genet. 12 , 683–691 (2011).
Article CAS PubMed Google Scholar Gaulton, K. J., Preissl, S. & Ren, B. Interpreting non-coding disease-associated human variants using single-cell epigenomics.
Nat. Rev. Genet.
24 , 516–534 (2023). Article PubMed Central CAS PubMed Google Scholar Yang, D.-D., Rusch, L. M., Widney, K.
A., Morgenthaler, A. B. & Copley, S. D.
Synonymous edits in the Escherichia coli genome have substantial and condition-dependent effects on fitness. Proc. Natl Acad.
Sci. USA 121 , e2316834121 (2024). Article PubMed Central CAS PubMed Google Scholar Walsh, I.
M., Bowman, M. A., Santarriaga, I. F.
S., Rodriguez, A. & Clark, P. L. Synonymous codon substitutions perturb cotranslational protein folding in vivo and impair cell fitness.
Proc. Natl Acad. Sci.
USA 117 , 3528–3534 (2020). Article PubMed Central CAS PubMed Google Scholar Kristofich, J. et al. Synonymous mutations make dramatic contributions to fitness when growth is limited by a weak-link enzyme.
PLoS Genet. 14 , e1007615 (2018). Article PubMed Central PubMed Google Scholar Jiang, T., Gill, D., Butterworth, A.
S. & Burgess, S. An empirical investigation into the impact of winner’s curse on estimates from Mendelian randomization. Int.
J. Epidemiol. 52 , 1209–1219 (2022).
Article Google Scholar Peterson, R. E. et al. Genome-wide association studies in ancestrally diverse populations: opportunities, methods, pitfalls, and recommendations.
Cell 179 , 589–603 (2019). Article PubMed Central CAS PubMed Google Scholar Palasantzas, V. E.
J. M. et al. iPSC-derived organ-on-a-chip models for personalized human genetics and pharmacogenomics studies. Trends Genet.
39 , 268–284 (2023). Article CAS PubMed Google Scholar Scholtens, S. et al. Cohort profile: LifeLines, a three-generation cohort study and biobank.
Int. J. Epidemiol.
44 , 1172–1180 (2015). Article PubMed Google Scholar Zhernakova, A. et al. Population-based metagenomics analysis reveals markers for gut microbiome composition and diversity.
Science 352 , 565–569 (2016). Article PubMed Central CAS PubMed Google Scholar Horst, R. et al. Sex-specific regulation of inflammation and metabolic syndrome in obesity.
Arterioscler. Thromb. Vasc.
Biol. 40 , 1787–1800 (2020). Article PubMed Central PubMed Google Scholar Vila, A.
V. et al. Gut microbiota composition and functional changes in inflammatory bowel disease and irritable bowel syndrome. Sci.
Transl. Med. 10 , eaap8914 (2018).
Article CAS Google Scholar Eggink, H. M. et al. Complex interaction between circadian rhythm and diet on bile acid homeostasis in male rats.
Chronobiol. Int. 34 , 1339–1353 (2017).
Article CAS PubMed Google Scholar Hoogerland, J. A. et al. Glucose-6-phosphate regulates hepatic bile acid synthesis in mice.
Hepatology 70 , 2171–2184 (2019). Article PubMed Central CAS PubMed Google Scholar García-Villalba, R. et al. Alternative method for gas chromatography-mass spectrometry analysis of short-chain fatty acids in faecal samples.
J. Sep. Sci.
35 , 1906–1913 (2012). Article PubMed Google Scholar Sanna, S. et al. Causal relationships among the gut microbiome, short-chain fatty acids and metabolic diseases.
Nat. Genet. 51 , 600–605 (2019).
Article PubMed Central CAS PubMed Google Scholar Li, X. S. et al. Untargeted metabolomics identifies trimethyllysine, a TMAO-producing nutrient precursor, as a predictor of incident cardiovascular disease risk.
JCI Insight 3 , e99096 (2018). Article PubMed Central PubMed Google Scholar Andreu-Sánchez, S. et al. Unraveling interindividual variation of trimethylamine N -oxide and its precursors at the population level. iMeta 3 , e183 (2024).
Article PubMed Central PubMed Google Scholar Laan, T. vander et al. Fast LC–ESI-MS/MS analysis and influence of sampling conditions for gut metabolites in plasma and serum. Sci.
Rep. 9 , 12370 (2019). Article PubMed Central PubMed Google Scholar Fuhrer, T., Zampieri, M., Sévin, D.
C., Sauer, U. & Zamboni, N. Genomewide landscape of gene–metabolome associations in Escherichia coli . Mol.
Syst. Biol. 13 , 907 (2017).
Article PubMed Central PubMed Google Scholar Fuhrer, T., Heer, D., Begemann, B. & Zamboni, N. High-throughput, accurate mass metabolome profiling of cellular extracts by flow injection–time-of-flight mass spectrometry. Anal.
Chem. 83 , 7074–7080 (2011). Article CAS PubMed Google Scholar Chen, L. et al.
Influence of the microbiome, diet and genetics on inter-individual variation in the human plasma metabolome. Nat. Med.
28 , 2333–2343 (2022). Article PubMed Central CAS PubMed Google Scholar Baerlocher, G. M., Vulto, I., Jong, G.
D. & Lansdorp, P. M. Flow cytometry and FISH to measure the average length of telomeres (flow FISH).
Nat. Protoc. 1 , 2365–2376 (2006).
Article CAS PubMed Google Scholar Andreu-Sánchez, S. et al. Genetic, parental and lifestyle factors influence telomere length. Commun.
Biol. 5 , 565 (2022). Article PubMed Central PubMed Google Scholar Langmead, B. & Salzberg, S.
L. Fast gapped-read alignment with Bowtie 2. Nat.
Methods 9 , 357–359 (2012). Article PubMed Central CAS PubMed Google Scholar Bolger, A. M., Lohse, M. & Usadel, B.
Trimmomatic: a flexible trimmer for Illumina sequence data. Bioinformatics 30 , 2114–2120 (2014). Article PubMed Central CAS PubMed Google Scholar Aroney, S.
T. N. et al. CoverM: read alignment statistics for metagenomics.
Bioinformatics 41 , btaf147 (2025). Article PubMed Central CAS PubMed Google Scholar Chang, C. C. et al.
Second-generation PLINK: rising to the challenge of larger and richer datasets. GigaScience https://doi.org/10.1186/s13742-015-0047-8 (2015). Article PubMed Central PubMed Google Scholar Schwengers, O. et al.
Bakta: rapid and standardized annotation of bacterial genomes via alignment-free sequence identification. Microb. Genom.
7 , 000685 (2021). PubMed Central CAS PubMed Google Scholar Dong, S.-S. et al. LDBlockShow: a fast and convenient tool for visualizing linkage disequilibrium and haplotype blocks based on variant call format files.
Brief. Bioinform. 22 , bbaa227 (2020).
Article Google Scholar Costea, P. I. et al. Subspecies in the global human gut microbiome.
Mol. Syst. Biol.
13 , 960 (2017). Article PubMed Central PubMed Google Scholar Kang, H. M. et al.
Variance component model to account for sample structure in genome-wide association studies. Nat. Genet.
42 , 348–354 (2010). Article PubMed Central CAS PubMed Google Scholar Willer, C. J., Li, Y. & Abecasis, G.
R. METAL: fast and efficient meta-analysis of genomewide association scans. Bioinformatics 26 , 2190–2191 (2010).
Article PubMed Central CAS PubMed Google Scholar Abramson, J. et al. Accurate structure prediction of biomolecular interactions with AlphaFold 3. Nature 630 , 493–500 (2024).
Article PubMed Central CAS PubMed Google Scholar Meng, E. C. et al. UCSF ChimeraX: tools for structure building and analysis.
Protein Sci. 32 , e4792 (2023). Article PubMed Central CAS PubMed Google Scholar Jumper, J. et al.
Highly accurate protein structure prediction with AlphaFold. Nature 596 , 583–589 (2021). Article PubMed Central CAS PubMed Google Scholar Krivák, R. & Hoksza, D.
P2Rank: machine learning based tool for rapid and accurate prediction of ligand binding sites from protein structure. J. Cheminform.
10 , 39 (2018). Article PubMed Central PubMed Google Scholar Honorato, R. V. et al.
The HADDOCK2.4 web server for integrative modeling of biomolecular complexes. Nat. Protoc.
19 , 3219–3241 (2024). Article CAS PubMed Google Scholar Honorato, R. V. et al.
Structural biology in the clouds: the WeNMR-EOSC ecosystem. Front. Mol.
Biosci. 8 , 729513 (2021). Article PubMed Central PubMed Google Scholar Vangone, A. et al.
Large-scale prediction of binding affinity in protein–small ligand complexes: the PRODIGY-LIG web server. Bioinformatics 35 , 1585–1587 (2018). Article Google Scholar Kurkcuoglu, Z. et al.
Performance of HADDOCK and a simple contact-based protein–ligand binding affinity predictor in the D3R Grand Challenge 2. J. Comput.
Aided Mol. Des. 32 , 175–185 (2018).
Article CAS PubMed Google Scholar Schake, P., Bolz, S. N., Linnemann, K. & Schroeder, M. PLIP 2025: introducing protein–protein interactions to the protein–ligand interaction profiler.
Nucleic Acids Res. 53 , W463–W465 (2025). Article PubMed Central PubMed Google Scholar Wang, T. & Wade, R.
C. Comparative binding energy (COMBINE) analysis of OppA−peptide complexes to relate structure to binding thermodynamics. J.
Med. Chem. 45 , 4828–4837 (2002).
Article CAS PubMed Google Scholar Wang, X.-G. et al. Analysis of differences in the functional properties of the substrate binding proteins of the Borrelia burgdorferi oligopeptide permease (opp) operon. J.
Bacteriol. 186 , 51–60 (2004). Article PubMed Central CAS PubMed Google Scholar Zhou, P., Jin, B., Li, H. & Huang, S.-Y.
HPEPDOCK: a web server for blind peptide–protein docking based on a hierarchical algorithm. Nucleic Acids Res. 46 , W443–W450 (2018).
Article PubMed Central CAS PubMed Google Scholar The UniProt Consortium. UniProt: the universal protein knowledgebase in 2021. Nucleic Acids Res.
49 , D480–D489 (2020). Article Google Scholar The UniProt Consortium. UniProt: the Universal protein knowledgebase in 2025.
Nucleic Acids Res. 53 , D609–D617 (2024). Article Google Scholar Pertea, G. & Pertea, M.
GFF Utilities: GffRead and GffCompare. F1000Research 9 , 304 (2020). Article Google Scholar Rice, P., Longden, I. & Bleasby, A.
EMBOSS: the European Molecular Biology Open Software Suite. Trends Genet. 16 , 276–277 (2000).
Article CAS PubMed Google Scholar Buchfink, B., Reuter, K. & Drost, H.-G. Sensitive protein alignments at tree-of-life scale using DIAMOND. Nat.
Methods 18 , 366–368 (2021). Article PubMed Central CAS PubMed Google Scholar Kabsch, W. & Sander, C. Dictionary of protein secondary structure: Pattern recognition of hydrogen-bonded and geometrical features.
Biopolymers 22 , 2577–2637 (1983). Article CAS PubMed Google Scholar Hekkelman, M. L., Salmoral, D. Á, Perrakis, A. & Joosten, R.
P. DSSP 4: FAIR annotation of protein secondary structure. Protein Sci 34 , e70208 (2025).
Article PubMed Central CAS PubMed Google Scholar Guilloux, V. L., Schmidtke, P. & Tuffery, P. Fpocket: an open source platform for ligand pocket detection.
BMC Bioinform. 10 , 168 (2009). Article Google Scholar Krapp, L.
F., Abriata, L. A., Rodriguez, F. C. & Peraro, M.
D. PeSTo: parameter-free geometric deep learning for accurate prediction of protein binding interfaces. Nat.
Commun. 14 , 2175 (2023). Article PubMed Central CAS PubMed Google Scholar Rodrigues, C.
H. M., Myung, Y., Pires, D. E.
V. & Ascher, D. B. mCSM-PPI2: predicting the effects of mutations on protein–protein interactions. Nucleic Acids Res.
47 , W338–W344 (2019). Article PubMed Central CAS PubMed Google Scholar Seemann, T. Prokka: rapid prokaryotic genome annotation.
Bioinformatics 30 , 2068–2069 (2014). Article CAS PubMed Google Scholar Masulis, I. S. et al.
Between computational predictions and high-throughput transcriptional profiling: in depth expression analysis of the OppB trans-membrane subunit of Escherichia coli OppABCDF oligopeptide transporter. Res. Microbiol.
171 , 55–63 (2020). Article CAS PubMed Google Scholar Maqbool, A. et al. Compensating stereochemical changes allow murein tripeptide to be accommodated in a conventional peptide-binding protein.
J. Biol. Chem.
286 , 31512–31521 (2011). Article PubMed Central CAS PubMed Google Scholar Gilchrist, C. L.
M. et al. cblaster: a remote search tool for rapid identification and visualization of homologous gene clusters. Bioinform. Adv.
1 , vbab016 (2021). Article PubMed Central PubMed Google Scholar Almeida, A. et al. A unified catalog of 204,938 reference genomes from the human gut microbiome.
Nat. Biotechnol. 39 , 105–114 (2021).
Article CAS PubMed Google Scholar Schmidt, T. S. B. et al.
SPIRE: a searchable, planetary-scale mIcrobiome resource. Nucleic Acids Res. 52 , D777–D783 (2023).
Article Google Scholar Gertz, E. M., Yu, Y.-K., Agarwala, R., Schäffer, A. A. & Altschul, S.
F. Composition-based statistics and translated nucleotide searches: improving the TBLASTN module of BLAST. BMC Biol.
4 , 41 (2006). Article PubMed Central PubMed Google Scholar Horst, R. ter. 300OB (HFGP).
Mendeley Data https://data.mendeley.com/datasets/4tb8spry4b/1 (2021). Wang, D. & Fu, J. SNV-MWAS catalog.
Zenodo https://zenodo.org/records/22759492 (2026). Schwengers, O. Bakta database v5.1.
Zenodo https://zenodo.org/records/10522951 (2024). Wang, D. GRONINGEN-MICROBIOME-CENTRE/SNV-MWAS: SNV-MWAS.
Zenodo https://zenodo.org/records/19487654 (2026). Download references Acknowledgements We thank all the volunteers in the Lifelines cohort ( https://www.lifelines.nl/ ) and the Human Functional Genomics Project ( http://www.humanfunctionalgenomics.org/ ) for their participation and the project staff for their help and management; K.
McIntyre for critical reading and editing; and the Genomics Coordination Center for providing data infrastructure and access to high-performance computing clusters. Funding This study is supported by Netherlands Organization for Scientific Research (NWO)-VICI grant VI.C.202.022 (J.F.), NWO-VICI grant VI.C.232.074 (A.Z.), NWO-VENI grant 222.016 (D.W.), NWO-VENI grant 194.006 (D.V.Z.), NWO Gravitation grant ExposomeNL 024.004.017 (A.Z. and A.K.), European Research Council (ERC) Consolidator grant 101001678 (J.F.), Dutch Heart Foundation grant IN-CONTROL II (CVON2018-27 to J.F., A.Z., M.G.N., L.A.B.J., J.H.W.R. and N.P.R.), and the ZonMW ME/CFS research programme (10091012110015 to A.Z., 10091012110017 to A.K.).
Furthermore, N.P.R. and J.F. are financially supported by a consortium grant of the Dutch Heart Foundation (AtheroNeth; 01-001-2024-0601). N.P.R. is supported by a Vici grant of the Netherlands Organisation for Health Research and Development (ZonMw; 09150182410037). In addition, C.W. and J.F. are supported by the Netherlands Organ-on-Chip Initiative, an NWO Gravitation project (024.003.001) funded by the Ministry of Education, Culture and Science of the government of the Netherlands.
J.F. is also supported by the AMMODO Science Award 2023 for Biomedical Sciences from Stichting Ammodo. J.F. and A.Z. are supported by the NWO Knowledge and Innovation Covenant grant (KICH1.LWV04.21.01). A.Z. is also supported by the EU Horizon Europe Program grant INITIALISE (101094099).
S.S. is supported by the NextGeneration EU grant Project Age-It “Ageing Well in an Ageing Society” (DM MUR 1557 11.10.2022), ERC Starting Grant 2022 (101075624), and a NutrAGE grant (DM MUR 844 16.07.2021). R.K.W. is supported by the Seerave foundation and NWO. H.P. is supported by a joint fellowship from the UMCG and the CSC with grant number CSC202208060107.
R.G. is supported by an NWO Vidi grant VI.Vidi.233.079. The 300TZFG cohort received funding from the Joint Programming Initiative, A Healthy Diet for a Healthy Life (JPI-HDHL; project 529051018, TransMic), and ZonMw (the Netherlands Organization for Health Research and Development).
Author information Author notes These authors contributed equally: Archontis Goumagias, Sergio Andreu-Sánchez, Haoran Peng Authors and Affiliations Department of Genetics, University of Groningen, University Medical Center Groningen, Groningen, The Netherlands Daoming Wang ( 王道明 ), Archontis Goumagias, Sergio Andreu-Sánchez, Haoran Peng ( 彭浩然 ), Angel J.
Ruiz-Moreno, Daria V. Zhernakova, Tim Krempel, Yue Zhang ( 张悦 ), Jiafei Wu ( 吴佳斐 ), Alexander Kurilshikov, Ranko Gacesa, Serena Sanna, Cisca Wijmenga, Alexandra Zhernakova & Jingyuan Fu ( 傅静远 ) Department of Pediatrics, University of Groningen, University Medical Center Groningen, Groningen, The Netherlands Archontis Goumagias, Sergio Andreu-Sánchez, Haoran Peng ( 彭浩然 ), Angel J.
Ruiz-Moreno, Tim Krempel, Yue Zhang ( 张悦 ) & Jingyuan Fu ( 傅静远 ) Institute for Genetic and Biomedical Research, National Research Council, Cagliari, Italy Daria V. Zhernakova & Serena Sanna Department of Gastroenterology and Hepatology, University of Groningen, University Medical Center Groningen, Groningen, The Netherlands Ranko Gacesa & Rinse K.
Weersma Department of Internal Medicine, Radboud University Medical Center, Nijmegen, The Netherlands Godfrey S. Temba, Quirijn de Mast, Leo A. B.
Joosten, Niels P. Riksen, Joost H. W.
Rutten & Mihai G. Netea Department of Medical Biochemistry and Molecular Biology, KCMC University, Moshi, Tanzania Godfrey S. Temba, Vesla I.
Kullaya & Quirijn de Mast Radboud Community for Infectious Diseases, Radboud University Medical Center, Nijmegen, The Netherlands Godfrey S. Temba, Quirijn de Mast, Leo A. B.
Joosten & Mihai G. Netea Kilimanjaro Clinical Research Institute, Kilimanjaro Christian Medical Center, Moshi, Tanzania Vesla I. Kullaya Broad Institute of MIT and Harvard, Cambridge, MA, USA Ramnik J.
Xavier Department of Translational Immunology, Medfuture Institute for Biomedical Research, Iuliu Hațieganu University of Medicine and Pharmacy, Cluj-Napoca, Romania Leo A. B. Joosten & Mihai G.
Netea Department of Immunology and Metabolism, Life and Medical Sciences Institute, University of Bonn, Bonn, Germany Mihai G. Netea Authors Daoming Wang ( 王道明 ) Archontis Goumagias Sergio Andreu-Sánchez Haoran Peng ( 彭浩然 ) Angel J. Ruiz-Moreno Daria V.
Zhernakova Tim Krempel Yue Zhang ( 张悦 ) Jiafei Wu ( 吴佳斐 ) Alexander Kurilshikov Ranko Gacesa Godfrey S. Temba Vesla I. Kullaya Ramnik J.
Xavier Quirijn de Mast Leo A. B. Joosten Niels P.
Riksen Joost H. W. Rutten Mihai G.
Netea Serena Sanna Cisca Wijmenga Rinse K. Weersma Alexandra Zhernakova Jingyuan Fu ( 傅静远 ) Consortia Lifelines Cohort Study Rinse K. Weersma , Alexandra Zhernakova & Jingyuan Fu ( 傅静远 ) Human Functional Genomics Project Quirijn de Mast , Leo A.
B. Joosten , Niels P. Riksen , Joost H.
W. Rutten & Mihai G. Netea Contributions J.F. coordinated and supervised the study.
J.F., D.W., S.A.-S. and A.K. conceptualized the study. D.W. conducted data generation, harmonization and integration. D.W., A.G., S.A.-S., D.V.Z., H.P., T.K., J.W. and Y.Z. performed data analysis: D.W. for gut microbial SNV analysis, S.A.-S. for quasi-phaseability assessment, and D.W. and D.V.Z. for human genetics analysis.
R.G. processed metagenomic sequencing data in the Dutch Microbiome Project. H.P. and D.W. designed and constructed the database website. A.G., A.J.R.-M. and D.W. conducted protein structure-based analysis.
C.W., J.F. and A.Z. set up the Lifelines-DEEP cohort. C.W., J.F., A.Z. and R.K.W. set up the Dutch Microbiome Project. L.A.B.J., N.P.R., J.H.W.R. and M.G.N. set up the 500FG and 300OB cohorts.
G.S.T., V.I.K., R.J.X. and Q.d.M. set up the 300TZFG cohort. D.W. and J.F. drafted the manuscript. All authors reviewed and edited the manuscript.
Corresponding author Correspondence to Jingyuan Fu ( 傅静远 ) . Ethics declarations Competing interests R.K.W. acted as a consultant for Takeda, received unrestricted research grants from Takeda, Johnson & Johnson, Tramedico and Ferring, and received speaker fees from MSD, AbbVie and Janssen Pharmaceuticals.
A.Z. received a speaker fee from Nestle. The other authors declare no competing interests. Peer review Peer review information Nature thanks Curtis Huttenhower, John Lees, Katherine Pollard and Heiko Runz for their contribution to the peer review of this work.
Peer reviewer reports are available. Additional information Publisher’s note Springer Nature remains neutral with regard to jurisdictional claims in published maps and institutional affiliations. Extended data figures and tables Extended Data Fig.
1 Overview of microbial SNV data before and after filtering. a , Total number of species detected with SNVs in each cohort before filtering. b , Total number of gut microbial SNVs detected in each cohort before filtering. c , Distributions of detected SNV numbers of each species in each cohort before filtering. d , Proportion of detected SNVs in the core region of each species in each cohort before filtering. e , Number of common SNVs in the core region of each species in each cohort before filtering.
The distributions of common SNV numbers exhibit two peaks separated by approximately 1,000 SNVs (dashed horizontal line). For c – e , each data point represents one microbial species ( n = 881 for all datasets combined, n = 879 for DMP, n = 879 for LLD1, n = 878 for LLD2-APK, n = 874 for LLD2-FSK, n = 878 for 500FG-APK, n = 875 for 500FG-FSK, n = 878 for 300OB, n = 880 for IBD, and n = 875 for 300TZFG). f , Numbers of gut microbial species with at least 1,000 common SNVs in each cohort after filtering. g , Total numbers of common gut microbial SNVs kept for each cohort after filtering. h , Distributions of common SNV numbers of each species in each cohort after filtering. i , Proportion of common SNVs in the core region of each species in each cohort after filtering.
For h and i , each data point represents one microbial species ( n = 433 for all datasets combined, n = 247 for DMP, n = 207 for LLD1, n = 240 for LLD2-APK, n = 248 for LLD2-FSK, n = 200 for 500FG-APK, n = 256 for 500FG-FSK, n = 243 for 300OB, n = 154 for IBD, and n = 327 for 300TZFG).
The inner boxplots in c , d , e , h , and i show the summary statistics: the centre line represents the median, the box hinges represent the lower and upper quartiles of the distribution, whiskers extend no further than 1.5× interquartile range from the hinges, and data beyond the end of the whiskers are outliers plotted as individual points.
Source data Extended Data Fig. 2 Gut microbial SNV impact classes. Proportion of SNV impact classes in each species (see key for impacts).
Species are sorted by the total proportion of synonymous variants and non-protein-coding region variants. Source data Extended Data Fig. 3 SNV-MWAS workflow for defining robust and independent association signals.
Per-cohort linear mixed model association results were combined by meta-analysis, with study-wide significance defined as P < 5.42×10 −11 . Robust associations required nominal significance (P permutation <0.05) in two or more cohorts with consistent effect direction and confirmation by permutation testing (P permutation <0.05 in ≥ 2 cohorts).
Linked SNVs ( r 2 > 0.01 within 10 Mb) were grouped to yield independent signals. Numbers in blue indicate counts after each filtering step. Extended Data Fig.
4 SNV impact category distribution by phenotype. The bar plot shows the ratio of SNV impact category in the associated SNVs of each phenotype (number of associated SNVs >10), all phenotypes, and all common SNVs (background). Phenotypes are sorted by the ratio of start/stop codon variants and missense variants.
The horizontal dashed red line is the reference line indicating the ratio of start/stop codon variants and missense variants in the background (0.176). The red “+” and blue “-” indicate significant enrichment and depletion, respectively, of start/stop codon variants and missense variants compared to the background SNVs (Two-sided Chi-squared test, P < 0.05).
Significant enrichment was observed for Lifelines protein diet score (P = 2.01 × 10 −4 ), on-a-diet behaviour during the past month (P = 1.09 × 10 −10 ), thrombocyte count (P = 2.92 × 10 −4 ), waist circumference (P = 0.0366), beta blocker intake (P = 0.0193), and sex (P = 0.0211).
Significant depletion was observed for BMI (P = 0.0104), DBP (P = 0.0376), HbA1c (P = 0.0467), lymphocyte count (P = 0.00281), SBP (P = 0.00360), and body weight (P = 0.0357). P values were not adjusted for multiple comparisons. Source data Extended Data Fig.
5 Species with SNV-level associations supported by both the Dutch cohorts and the Tanzanian cohort. The heatmap shows the phenotype and species pairs with SNV-level associations supported by at least one Dutch cohort and the Tanzanian cohort. Source data Extended Data Fig.
6 Number of associations at gut microbial SNV, SV, or abundance levels. a , Number of significantly associated phenotype−species pairs at the different gut microbiome feature categories. b , Number of significantly associated species at the different gut microbiome feature categories for each phenotype.
Source data Extended Data Fig. 7 Quantile-quantile plot of meta-analysis results for age-associated SNVs in Faecalibacterium prausnitzii _I. Observed versus expected −log 10 (P) values for the association between age and microbial SNVs in F. prausnitzii _I (species ID: 102274).
P values were obtained from two-sided linear mixed-model tests in each cohort followed by sample-size-weighted meta-analysis and are shown without multiple-testing adjustment. The shaded region indicates the 95% confidence interval expected under the null hypothesis. The genomic inflation factor ( λ ) is shown.
Source data Extended Data Fig. 8 Association of SNVs in Faecalibacterium prausnitzii_ I with SVs and host age. a , Distribution of the SNV 102274_1617247 genotype in the phylogenetic tree of F. prausnitzii _I across all samples. b , Heatmap shows the Spearman’s correlation coefficients between age-associated SNVs and SVs of F. prausnitzii _I (FDR < 0.05). c , Heatmap shows the P-values of association between SNVs and host age after adjusting for the associated SVs in each cohort (P permutation <0.05).
P values were obtained using two-sided permutation-based linear mixed-model tests with 999 permutations; no multiple-testing adjustment was applied (P permutation <0.05). Source data Extended Data Fig. 9 Allele frequency and host age for age-associated SNVs in Faecalibacterium prausnitzii _I. a , Frequency of the alternative alleles for five age-associated SNVs in F. prausnitzii _I (species ID: 102274) across the six cohorts. b , Mean host age (years) across the six cohorts.
Source data Extended Data Fig. 10 In silico molecular docking between OppA of Faecalibacterium prausnitzii_ I, glutathione and potential ligands. ΔG predictions (Kcal/mol) from the in silico docking analysis are shown for the wild-type (WT) protein and the age-associated mutant (MUT).
Reference ligands: KAK, KWK, KKK, AAA, GFG, GAG, DED, and EEE. For each protein–ligand combination, n = 4 docked poses were analyzed. Horizontal and vertical dashes indicate the mean and standard deviation (SD), respectively.
Source data Rights and permissions Open Access This article is licensed under a Creative Commons Attribution-NonCommercial-NoDerivatives 4.0 International License, which permits any non-commercial use, sharing, distribution and reproduction in any medium or format, as long as you give appropriate credit to the original author(s) and the source, provide a link to the Creative Commons licence, and indicate if you modified the licensed material.
You do not have permission under this licence to share adapted material derived from this article or parts of it. The images or other third party material in this article are included in the article’s Creative Commons licence, unless indicated otherwise in a credit line to the material.
If material is not included in the article’s Creative Commons licence and your intended use is not permitted by statutory regulation or exceeds the permitted use, you will need to obtain permission directly from the copyright holder. To view a copy of this licence, visit http://creativecommons.org/licenses/by-nc-nd/4.0/ .
Reprints and permissions About this article Cite this article Wang, D., Goumagias, A., Andreu-Sánchez, S. et al. Microbiome-wide PheWAS links gut microbial SNVs to health and exposures. Nature (2026). https://doi.org/10.1038/s41586-026-11220-0 Download citation Received : 10 September 2024 Accepted : 28 September 2026 Published : 04 November 2026 Version of record : 04 November 2026 DOI : https://doi.org/10.1038/s41586-026-11220-0
Article text via FreeNewsAPI. Rights remain with Nature.
Read on publisher site → Opens Nature in a new tab