Mapping the Tibetan Plateau microbiome across ecosystems provides a resource for biodiscovery
MainMicrobial genetic resources are fundamental to addressing some of the grandest challenges of humanity, including antibiotic resistance, environmental contamination and sustainable biomanufacturing....
Main Microbial genetic resources are fundamental to addressing some of the grandest challenges of humanity, including antibiotic resistance, environmental contamination and sustainable biomanufacturing. Prokaryotes are the most diverse and abundant form of life, accounting for at least half of the total diversity on Earth 1 , 2 .
They also represent a major reservoir of genetic and biochemical potential for innovation in biotechnology and medicine, playing central roles in biogeochemical cycling and product biosynthesis. Landmark projects, such as the Tara Pacific Oceans Expedition 3 , Genomic Catalog of Earth’s Microbiomes (GEM) 4 and the Mariana Trench Environment and Ecology Research (MEER) Project 5 , have greatly expanded our understanding of global microbial diversity.
These projects have recovered remarkable biosynthetic potential from marine and terrestrial ecosystems, highlighting the value of systematic microbial resource exploration. Despite these advances, systematic microbiome surveys of the Tibetan Plateau, Earth’s largest cryospheric region besides Antarctica and the Arctic, have not been conducted so far.
The Tibetan Plateau (2.5 million km 2 ) harbours unique ecosystems at an average elevation of 4,000 m above sea level, characterized by strong ultraviolet radiation, extreme temperature fluctuations and prolonged isolation since the Miocene uplift (about 17 million years ago (Ma)) 6 , 7 .
These environmental settings and selective forces create a natural evolutionary laboratory expected to promote unusual metabolic and functional traits of prokaryotes. However, the potential of these traits remains largely unexplored for biotechnology. An earlier study on glacier microbiomes from the Tibetan Plateau revealed substantial microbial novelty (more than 88% of the recovered bacterial genomes represented previously undescribed species) with 75% of the identified bacteria unique to individual glaciers, highlighting their vulnerability to extinction 8 .
Subsequent studies on rivers, lakes and soils across the Tibetan Plateau have improved our understanding of microbial community composition and function 8 , 9 , 10 , 11 . However, existing efforts have focused on individual ecosystems or specific functions, rather than providing an integrated, application-oriented genomic resource that spans the full range of the Tibetan Plateau ecosystems.
This limitation is concerning, given that the Tibetan Plateau warms at twice the global average rate 12 , potentially threatening cold-adapted and stress-specialized microorganisms 13 , 14 . Ultimately, this risks the loss of valuable microbial resources even before their functional potential can be explored.
Global metagenome projects have increasingly revealed the immense biotechnological potential encoded in microbial genomes. For instance, the bioactive compounds of the ocean microbiome 15 and the discovery of antimicrobial peptides (AMPs) 16 highlight microbial ‘dark matter’ as a rich source of previously undescribed bioactive compounds.
Likewise, surveys on soils have shown that their microbiome harbours genes encoding various AMPs, biosynthetic gene clusters (BGCs) and CRISPR–Cas systems 17 . Microorganisms that thrive under extreme temperatures, pressure, radiation and salinity have evolved atypical metabolic pathways as adaptive strategies 18 .
For instance, psychrophilic bacteria have evolved enzymes that remain functional at subzero temperatures and drive elemental cycling in glaciers and permafrost 19 , 20 . Strong ultraviolet (UV) radiation induces DNA mutations and promotes the evolution of protective traits, such as enhanced DNA repair and protective pigment production 21 .
Similarly, competition for resources in oligotrophic environments fuels the arms race among microorganisms, involving antibiotic resistance genes and CRISPR–Cas systems 22 . We also examined plastic-degrading enzymes, as the Tibetan Plateau provides a unique and extreme environment that fosters diverse microbial communities with plant polymer-degrading capabilities and potential for evolving robust, industrially relevant plastic-degrading enzymes 23 .
Such adaptations can directly translate into valuable bioactive compounds, industrial enzymes and programmable molecular tools, positioning extreme environments as rich yet underexploited sources for biotechnology 24 . To explore the diversity and bioprospecting potential of the Tibetan Plateau microbiome, we conducted a region-wide metagenomic survey.
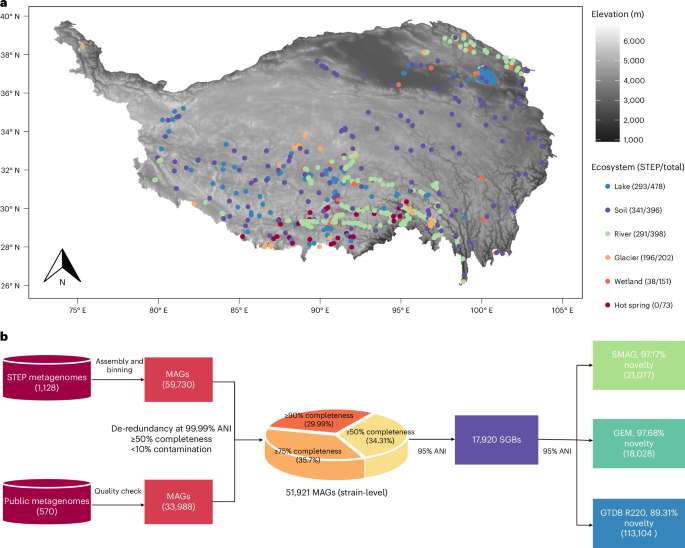
We analysed 1,698 samples from 868 sites spanning six ecosystems (soils, wetlands, lakes, rivers, hot springs and glaciers) across an elevation gradient from 1,000 to 6,700 m above sea level (Fig. 1a and Supplementary Table 1 ). From the 55.05-Tb metagenomes obtained, we generated 51,921 strain-level metagenome-assembled genomes (MAGs), forming the Tibetan Environmental Genome (TEG) catalogue (Fig.
1b and Supplementary Table 2 ). TEG substantially expands current knowledge of microbial biodiversity by filling phylogenetic gaps, identifying 16,005 previously undescribed species across 105 phyla. Beyond taxonomic diversity, TEG recovers more than 44,000 BGCs, 19,000 candidate AMPs (cAMPs), 1,262 low-identity CRISPR–Cas systems and 1,077 putative polyethylene terephthalate (PET) hydrolases.
These resources position the Tibetan Plateau as a notable reservoir of microbial genetic diversity relevant to biotechnology and medicine. They fill a critical geographic gap in global bioprospecting efforts and provide a scalable framework for discovering and prioritizing microbial resources from high-mountain ecosystems.
Fig. 1: Construction of the TEG catalogue. a , Geographical distribution of metagenomic samples. The colours of the dots correspond to the six ecosystem types: lakes, soils, rivers, glaciers, wetlands and hot springs.
The number of samples from the STEP Program, as well as the total number of samples, is indicated in parentheses. b , In total, 51,921 strain-level MAGs met the Minimum Information about a Metagenome-Assembled Genome criteria for medium quality or above 88 , and were clustered into 17,920 SGBs.
Representative SGBs from GTDB R22089 , GEM 4 and SMAG 17 were included in the clustering to assess the Tibetan Plateau species. Values in parentheses represent the number of SGBs. Taxonomic diversity of prokaryotes Kraken2 results showed that the dataset was dominated by prokaryotic reads, while fungal and viral reads showed extremely low mean relative abundance of 0.49% and 0.51%, respectively (Extended Data Fig.
1a and Supplementary Data 1 ). Therefore, this work primarily focuses on the metagenome bins of prokaryotic origins. A total of 55.05 Tb of metagenomic sequencing data were generated, and read recruitment rates to assembled contigs averaged 46.12%.
The TEG catalogue comprises 51,921 strain-level MAGs of medium or high quality, with average completeness and contamination values of 79.99% and 2.85%, respectively (Extended Data Fig. 1b ). Of these, 14,061 (27.09%) are high-quality genomes, whereas 37,860 (72.91%) are medium-quality genomes.
These genomes span 105 bacterial and archaeal phyla, with bacteria accounting for 97.57% and archaea for 2.43% of the recovered genomes. They were further classified into 3,371 genera and 17,920 species-level genome bins (SGBs, defined as MAGs grouped into species-level bins at 95% average nucleotide identity (ANI), a widely accepted threshold for delineating species-level boundaries 17 , 25 , 26 ) (Fig.
2a and Supplementary Table 2 ). In terms of the number of SGBs, the majority (72.98%) of SGBs were affiliated with Pseudomonadota (31.34%), Bacteroidota (16.85%), Actinomycetota (15.25%), Patescibacteria (5.28%) and Verrucomicrobiota (4.26%) (Fig. 2b ).
SGBs in soils were dominated by Actinomycetota (25.81%), whereas Pseudomonadota accounted for a larger proportion of SGBs in non-soil ecosystems, particularly glaciers, highlighting distinct taxonomic compositions across Tibetan Plateau ecosystems (Fig. 2b and Extended Data Fig. 1c ).
Fig. 2: The TEG catalogue expands the tree of life. a , A phylogenetic tree of the 17,920 SGBs was constructed using 120 universal bacterial marker genes and 53 universal archaeal marker genes 95 . The colours of the tree branches correspond to the phylum-level taxonomic annotations of GTDB R220. b , Phylum-level taxonomic composition across distinct ecosystems, showing the top-nine phyla ranked by SGB counts, with all remaining phyla grouped as ‘Others’. c , Number and percentage of taxa that are newly identified and lack formal nomenclature at each taxonomic level.
To evaluate the taxonomy of TEG, we compared the TEG SGBs with two global genome datasets, the Global Soil MAG (SMAG) 17 and GEM 4 . Despite the complementary scope of these references, 97.17% and 97.68% of TEG SGBs were absent from SMAG and GEM, respectively (Fig. 1b ), indicating that TEG captures extensive taxonomic diversity not represented in the current global microbial genome datasets.
To further assess the taxonomic resolution, we evaluated TEG SGBs against the Genome Taxonomy Database (GTDB release R220), the most comprehensive reference framework for prokaryotic classification. Notably, 0.13%, 0.33%, 1.50%, 13.62% and 89.31% of the SGBs could not be assigned at the class, order, family, genus and species level, respectively (Fig.
2c and Supplementary Tables 2 and 3 ), revealing that a large proportion of the Tibetan Plateau microorganisms remain remarkably uncharacterized within existing taxonomic systems. This pattern was largely driven by Bacteria, in which 13.29% and 87.10% of SGBs were unclassified at the genus and species levels, respectively.
By contrast, only 0.33% and 2.21% of archaeal SGBs remained unclassified at these levels (Supplementary Table 2 ). In addition, Sylph‐based profiling revealed that unclassified SGBs averaged 79.06% relative abundance across ecosystems (Extended Data Fig. 2a and Supplementary Data 2 ), yet 93.40% of them occurred in fewer than 10% of samples (Extended Data Fig.
2b ), indicating that these taxa are locally abundant yet regionally rare. These lineages expand known phylogenetic breadth, with the greatest expansion at the phylum, class, order, family and genus levels observed for J088, JAICYB01, UBA8317, BP-191 and JADGNW01 , respectively (Extended Data Fig.
2c ). Relative to GTDB release R220, these lineages showed 5-, 5-, 7-, 12- and 21-fold increases in the number of SGBs (Supplementary Table 3 ), indicating the Tibetan Plateau as a major source of previously overlooked microbial diversity. Taking the family-level BP-191 and genus-level JADGNW01 as examples, both the phylogenetic tree constructed from 120 bacterial marker genes and the average amino acid identity demonstrated that species within the TEG substantially expanded the diversity of these lineages (Extended Data Fig.
2d–e ). Together, these analyses demonstrate that the TEG catalogue does not merely increase genome counts but systematically extends the tree of life into underexplored high-mountain environments, providing a robust taxonomic foundation for downstream functional annotation and bioprospecting efforts.
BGCs From the TEG, we predicted 44,719 BGCs in 13,347 (74.48%) of the SGBs after restricting BGC prediction to contigs of ≥5 kb in length, highlighting the widespread biosynthetic potential across the Tibetan Plateau prokaryotes. The BGCs were clustered into 30,666 gene cluster families within 174 gene cluster clans (that is, gene families that share a common evolutionary origin) (Supplementary Table 4 ).
Terpenes, ribosomally synthesized and post-translationally modified peptides (RiPPs) and non-ribosomal peptide synthetases (NRPS) were dominant, together accounting for 66.23% of the BGCs (Fig. 3a,b ). Terpenes were identified in 8,813 SGBs from 55 phyla, making them the most widespread BGC class (Supplementary Table 4 ).
This dominance contrasts with the marine environment, where RiPPs typically prevail 15 , 27 . Notably, of the 179 (0.40%) archaeal BGCs recovered from the phyla Halobacteriota and Thermoplasmatota, 20 corresponded to NRPS‐ and PKS‐associated BGCs. Compared with the experimentally validated MiBiG 4.0 (ref.
28 ) and computationally predicted BGC Atlas 29 derived from global broad ecosystems, at least 97.14% of the identified gene clusters lacked close matches in existing references, indicating previously uncharacterized biosynthetic capacity (Fig. 3d and Supplementary Table 5 ), substantially expanding the global BGC inventory.
Fig. 3: The distribution of BGCs. a , BiG-SCAPE classification of 44,719 BGCs. b , Proportions of BGC types across ecosystems. c , Rain cloud plot showing differences in BGC-encoding density across ecosystems. Each dot represents one SGB, and BGC-encoding density was calculated as the number of BGCs per Mb of the SGB genome ( n = 2,420 soil, n = 2,962 wetland, n = 4,262 lake, n = 2,047 river, n = 489 hot spring and n = 1,167 glacier SGBs).
Boxplots show the median (centre line), interquartile range (hinges) and 1.5× IQR whiskers. Differences among ecosystems were assessed using the Kruskal–Wallis test followed by post hoc multiple comparisons. Groups sharing a letter are not significantly different at α = 0.05. d , Comparisons of BGCs against computationally predicted (BGC Atlas 29 ) and experimentally validated (MIBiG 4.0 28 ) BGC datasets uncovered a substantial number of previously undescribed BGCs (L2-normalization-based cosine-like distance >0.4). e , f , Relationships between genome size and BGC count ( e ) or BGC density ( f ) across phyla, showing the top-nine phyla ranked by total BGC counts for visualization, with the remaining phyla grouped as ‘Others’.
Locally estimated scatterplot smoothing curves show fitted relationships, with shaded areas indicating 95% confidence intervals. Two-sided Spearman’s rank correlation tests were used to assess the relationships; exact P values are shown. The composition of BGC types varied greatly across ecosystems and taxonomic groups (Fig.
3b ). NRPS clusters, which are commonly associated with antibiotics and immunosuppressants 30 , were enriched in soils (24.12%), approximately threefold higher than those in hot spring microbiomes. Glacier-derived SGBs exhibited the highest BGC coding density, with 1.03 BGCs per megabases (Mb) genome on average, which may suggest intensified selection for specialized metabolism in cold and oligotrophic ecosystems (Fig.
3c ). In terms of BGC gene cluster families, 24.04% were detected in two or more ecosystems, indicating a high degree of ecosystem specificity in their distribution (Supplementary Table 4 ). Furthermore, aside from Myxococcota, Eremiobacterota and Acidobacteriota, which had average BGC counts exceeding six and BGC densities above one per Mb, two uncultivated phyla (JAGRBM01 and JAUVQV01) also demonstrated high BGC encoding potential (Extended Data Fig.
3 ). This indicates that these taxa represent promising candidates for the discovery of previously undescribed natural products. To further examine biosynthetic investment strategies, we quantified both BGC number and BGC density at the genome level and explored their relationships with genome size (Fig.
3e,f ). Across all SGBs, BGC number was significantly positively correlated with genome size ( R = 0.42, P < 2.2 × 10 −16 ), indicating that larger genomes encode more BGCs. This positive correlation was observed in 16 of the 20 phyla (each with ≥50 SGBs).
Furthermore, the proportion of genomes encoding BGCs varies across phyla (ranging from 27.67% to 87.00%), indicating that BGC encoding is not a fixed percentage across all lineages. However, this trend exhibited a bell-shaped distribution in certain phyla such as Acidobacteriota, Chloroflexota, Cyanobacteriota and Bacillota, where BGC numbers began to decline beyond a certain genome size threshold (Fig.
3e and Extended Data Fig. 4 ). Compared with BGC numbers, BGC density exhibited lineage-specific patterns.
Only Acidobacteriota and Myxococcota showed a strong positive correlation between BGC density and genome size, while 14 phyla displayed negative correlations, 9 of which were statistically significant (Fig. 3f and Extended Data Fig. 5 ).
These divergent scaling relationships indicate that biosynthetic potential is not a simple by-product of genome expansion but instead reflects lineage-specific evolutionary strategies, with important implications for prioritizing taxa in future bioprospecting efforts. AMPs We obtained 19,168 cAMPs, which were clustered into 18,309 families at thresholds of 75% amino acid identity and 80% alignment coverage, following the protocol established by Santos-Júnior et al.
16 (Supplementary Table 6 ). Further assessment of the overlap between cAMPs and antiSMASH‐predicted RiPPs ( Methods ) showed only 0.73% and 0.13% matching under relaxed and stringent identity thresholds, respectively, indicating nearly distinct peptide repertoires. The amino acid frequencies of cAMP families demonstrated consistent patterns with DRAMP 31 and the positive training set used in Macrel 32 (Fig.
4a,b ), a machine learning-based tool specifically developed for the identification and characterization of AMPs. Such features include a positive net charge (4.41 ± 2.48), a high isoelectric point (11.03 ± 1.30), amphipathicity (hydrophobic moment: 0.58 ± 0.14) and membrane-binding potential (Boman index: 1.14 ± 1.06) (Extended Data Fig.
6 ). In addition, TEG cAMPs possessed previously undescribed features, including a high frequency of the amino acid alanine and a low frequency of cysteine (Fig. 4b and Extended Data Fig.
7 ). The TEG cAMPs had only 16.50% and 0.04% represented in the global metagenomic AMP dataset (AMPsphere) 16 and experimentally verified DRAMP 4.0 31 , respectively, and none being identified in APD3 33 or DBAASP3 34 (Supplementary Table 6 ). Fig.
4: Identification of AMPs. a , Principal component analysis based on amino acid frequencies shows that TEG cAMPs differ from non-AMPs (Macrel negative 109 ) and are similar to experimentally validated AMPs (DRAMP 4.0 31 and Macrel positive 109 ). b , Normalized amino acid frequency calculated from TEG cAMPs, from Macrel positive and negative AMPs, from AMPs in the DRAMP 4.0. c , d , UpSet plots showing overlap of cAMPs across ecosystems ( c ) and microbial phyla ( d ).
Left horizontal bars indicate total cAMP counts, connected dots indicate shared cAMPs among combinations and vertical bars represent intersection sizes. e , The density of cAMPs shows a significant ( R = −0.37, P < 1 × 10 −16 ) negative correlation with corrected genome size. Two-sided Spearman’s rank correlation tests were used to assess the relationships. f , MIC values of the 29 cAMPs against S. aureus ATCC 25923, S. epidermidis ATCC 12228, E. coli ATCC 4157, P. aeruginosa ATCC 29853, P. syringae ATCC 19875, F. oxysporum ATCC 48112 and F. pseudograminearum zbs1.
All the assays were performed in three independent replicates. Gram-positive (+) and Gram-negative (−) bacteria are indicated by the legend on the right. The cAMP repertoire was further characterized by extreme sequence rarity, with 90.03% of the cAMP families containing only one sequence and only 0.11% of the cAMPs being shared across multiple ecosystems (Fig.
4c,d and Supplementary Table 6 ). This pronounced lineage and ecosystem specificity suggested that TEG cAMPs are probably shaped by local environmental pressures, potentially important for microbial survival and competition. cAMPs were widely distributed across 89 bacterial and archaeal phyla (Supplementary Table 6 ).
Across genomes, cAMP density was negatively correlated with genome size ( R = −0.37, P < 1 × 10 −16 ) (Fig. 4e ), with particularly high densities observed in prokaryotes with small genomes, including PUNC01, Aenigmatarchaeota, Patescibacteria and Nanoarchaeota (Extended Data Fig.
8 ). These lineages are frequently associated with symbiotic or host-dependent lifestyles, suggesting that cAMPs may play important roles in mediating microbial interactions and competitive dynamics in resource-limited environments 35 . To evaluate whether the TEG cAMPs bear potential for antimicrobial activity, we conducted a targeted proof-of-concept assessment.
A total of 30 sequences were selected for chemical synthesis, and among them, 29 were successfully synthesized and subjected to in vitro minimum inhibitory concentration (MIC) assays against seven representative pathogenic microorganisms, including Gram-positive and Gram-negative human opportunistic pathogens, as well as phytopathogenic bacteria and fungi ( Methods ).
All 29 AMPs exhibited inhibitory activity against at least one tested pathogen (Fig. 4f and Supplementary Table 7 ), indicating activity across the tested pathogen panel. Notably, five peptides (AMP2, AMP9, AMP13, AMP14 and AMP20) showed broad-spectrum activity against all tested pathogens, with mean MIC values ranging from 17.14 to 29.14 μg ml −1 .
Among these, AMP2 showed particularly strong activity, with low MIC values against Staphylococcus epidermidis (8 μg ml −1 ), Staphylococcus aureus (16 μg ml −1 ), Escherichia coli (64 μg ml −1 ), Pseudomonas aeruginosa (16 μg ml −1 ), Pseudomonas syringae (4 μg ml −1 ), Fusarium oxysporum (8 μg ml −1 ) and Fusarium pseudograminearum (4 μg ml −1 ).
Moreover, seven peptides inhibited five or more pathogens, with performance comparable to or exceeding that of the reference peptide LL-37, a well-established naturally human-derived AMP 36 . Furthermore, eight peptides inhibited all four human opportunistic pathogens, whereas twelve peptides showed simultaneous activity against both phytopathogenic bacteria and fungi.
Notably, four peptides (AMP2, AMP14, AMP20 and AMP25) exhibited low MIC values of 4–8 μg ml −1 against the plant pathogenic fungi F. oxysporum and F. pseudograminearum , comparable to those reported for some of the most effective antifungal peptides described previously 37 , 38 .
Together, these results illustrate how genome-guided discovery within the TEG resource can efficiently yield bioactive antimicrobial candidates. CRISPR–Cas systems We identified 1,262 CRISPR–Cas systems spanning 35 subtypes across 47 bacterial and archaeal phyla, including 566 complete CRISPR arrays (Fig.
5a and Supplementary Table 8 ). Except for 15 CRISPR–Cas systems from Archaea, 98.78% were derived from Bacteria (Supplementary Table 8 ). The CRISPR–Cas systems in archaea were dominated by type I (80.0%).
By contrast, the subtype composition was highly uneven in bacteria, with types I-C, I-E, II-C and I-B being the most prevalent, indicating a biased but structured distribution of CRISPR–Cas systems across microbial lineages (Extended Data Fig. 9a ). At the ecosystem level, hot springs had the highest CRISPR–Cas coding density (count per Mb genome), while glaciers and soils had relatively fewer systems (Fig.
5b ). This pattern is consistent with previous reports showing that environmental factors such as temperature and ecosystem type are associated with variation in CRISPR–Cas prevalence 15 , 39 , 40 . Fig.
5: The distribution of CRISPR–Cas systems among lineages and ecosystems. a , Chord diagram showing the types of CRISPR–Cas systems across different ecosystems. b , Rain cloud plot showing coding density in CRISPR–Cas systems across ecosystems. Each dot represents one SGB and CRISPR–Cas density was calculated as the number of CRISPR–Cas systems per Mb of the SGB genome ( n = 157 soil, n = 389 wetland, n = 371 lake, n = 139 river, n = 103 hot spring and n = 103 glacier SGBs).
Boxplots show the median (centre line), interquartile range (hinges) and 1.5× IQR whiskers. Differences among ecosystems were assessed using the Kruskal–Wallis test followed by post hoc multiple comparisons. Groups sharing a letter are not significantly different at α = 0.05. c , Bar plot indicating the normalized frequency of CRISPR–Cas systems across phyla.
The blue line represents the total number of genomes for each lineage. Notably, we identified 216 complete Cas9 proteins (Supplementary Table 9 ), a programmable nuclease widely used in genetic manipulation 35 . These Cas9 proteins showed low amino acid sequence identity (57.54% ± 16.19%) to previously characterized homologues and expanded the phylogenetic coverage to seven phyla (Extended Data Fig.
9b and Supplementary Table 9 ). These findings further highlight prokaryotic diversity and the potential of previously undescribed sequences in the Tibetan Plateau ecosystems. Only 23 SGBs contained more than one CRISPR–Cas system (Supplementary Table 8 ), suggesting multiple viral infection events.
Cas subtype distributions were structured by taxonomy rather than ecosystem, reflecting a linkage between Cas subtypes and host lineages. For instance, Pseudomonadota were dominated by type I-F, whereas Bacteroidota were dominated by type II-C (Fig. 5c ).
Consistent with previous observations, we did not detect any ecosystem-specific Cas systems, reinforcing the view that Cas diversity is largely governed by host phylogeny rather than direct environmental filtering 15 . Although Pseudomonadota, Bacteroidota and Bacillota contained a limited number of Cas systems, Bacillota_F and Sumerlaeota had an exceptionally high Cas inventory, averaging three Cas systems per SGB (Fig.
5c ), suggesting enhanced viral defence capacity in these lineages. Plastic-degrading enzymes Across all studied ecosystems, we identified 224,570 homologues of plastic-degrading enzymes (Fig. 6a and Supplementary Table 10 ) by comparing them against the 219 curated references from the PlasticDB 41 .
Most of the identified sequences were from lakes and soils, whereas they were rare in hot springs. Focusing on sequences exhibiting high amino acid identity to reference sequences (identity >75% and coverage >80%) 42 , we retained 812 putative plastic-degrading enzymes from 584 SGBs (Fig.
6b and Supplementary Table 10 ). Approximately 70% of these sequences encode enzymes potentially capable of degrading multiple plastics. Of these, 32.12% target poly(3-hydroxyvalerate) (P3HV), poly(3-hydroxybutyrate-co-3-hydroxyvalerate) (PHBV), and polyhydroxyalkanoate (PHA), while 10.24% act on polyhydroxybutyrate (PHB) and PHA.
Furthermore, 13.90% of the SGBs associated with potential plastic-degrading enzymes were predicted to have an optimal growth temperature below 25 °C (Supplementary Table 10 ). This finding provides potentially valuable genetic resources for plastic degradation under low-temperature conditions.
Fig. 6: The distribution of plastic-degrading enzymes among lineages and ecosystems. a , Distribution of plastic-degrading enzymes across ecosystems, categorized as high-similarity and others. High-similarity plastic-degrading enzyme sequences were identified with ≥75% identity and 80% coverage 42 .
Sequences that failed to meet these criteria were grouped as ‘Others’. Numbers in parentheses indicate the total number of proteins in each category. b , Bubble chart showing the types and phylum-level distribution of plastic-degrading enzymes with high similarity. c , Phylogenetic analysis of the 1,077 previously undescribed PET hydrolase candidates. d , Ecosystem origin of different PET hydrolase clades.
See also Extended Data Fig. 10 for information about the clades. PET is one of the most extensively used plastics, but its complex structure makes it recalcitrant in natural environments 43 .
We identified 1,077 candidate PET hydrolases with a GxSxG motif, conserved Ser-Asp-His catalytic triad and a signal peptide (Extended Data Fig. 10 and Supplementary Data 3 ). Phylogenetic analyses revealed substantial diversity, with PET hydrolases broadly distributed across diverse phyla and ecosystems (Fig.
6c,d ). Furthermore, the PET hydrolases exhibited low sequence identity to the reference enzyme (19.58% on average). To improve the reliability of functional prediction, we modelled the three-dimensional structures of the candidate proteins using ESMFold 44 .
The resulting models had an average predicted local-distance difference test score of 87.31, indicating high confidence in the predicted structures 44 (Extended Data Fig. 10a and Supplementary Data 3 ). Furthermore, the crystal structure of Ca PETase M9 (PDB ID: 7YME ) was used as a reference template for structural similarity alignment of all predicted candidate proteins.
The engineered Ca PETase M9 variant has a melting temperature ( T m ) of 83.2 °C and exhibits high PET-hydrolysing activity at 60 °C (ref. 45 ). The results demonstrated that the average TM-score between the candidate proteins and the 7YME structure was 0.74, indicating a relatively high level of structural similarity 46 .
Among these candidates, FOLKBIDJ_00188 displayed the highest structural similarity to 7YME (TM-score of 0.96), despite sharing only 48.21% amino acid sequence identity. In addition, the predicted optimal temperature of FOLKBIDJ_00188 was 60.49 °C (Extended Data Fig. 10b ).
IICGMEOL_00919, sourced from a hot spring, had a predicted optimal temperature ( T opt ) of 69.48 °C and a host optimal growth temperature of 44.80 °C, suggesting a potential for elevated enzymatic activity. By contrast, NEFNCAGP_00928, sourced from a glacier, had a genome-predicted optimal growth temperature of 19.98 °C, implying adaptation to cold environments.
This finding highlights NEFNCAGP_00928 as a candidate for future experimental assessment of PET degradation at low to moderate temperatures. Finally, PJKDDHHC_00981 from soils exhibited the highest predicted optimal pH (pH opt of 9.84), indicating tolerance to alkaline conditions.
Together, these results suggest that PET hydrolases from the Tibetan Plateau represent promising targets for the discovery of PET-degrading enzymes. Discussion We conducted a comprehensive metagenomic survey across diverse ecosystems on the Tibetan Plateau. Nearly 90% of the recovered genomes could not be assigned to described species in current reference databases, substantially expanding the global landscape of prokaryotic diversity.
Besides serving as an ecological census, this high level of previously undescribed taxa underscores the Tibetan Plateau as a hitherto poorly recognized reservoir of genetic resources 18 . In contrast to previous studies that focused on single ecosystems or specific biogeochemical cycles 8 , 9 , 47 , we leveraged a cross-ecosystem perspective to establish a systematic bioprospecting repository, including BGCs, AMPs, CRISPR–Cas systems and potentially plastic-degrading enzymes.
Within this framework, targeted experimental validation of AMPs was designed as a proof-of-concept to demonstrate how genome-resolved resources can be translated into functional discovery at scale. We found that 97% of the BGCs in the TEG exhibited low sequence homology to known databases.
The high proportion of previously undescribed BGCs mirrors the high proportion of previously undescribed species, a relationship previously reported in glacier stream 48 , marine 49 and terrestrial soil 17 microbiome studies. The synergistic effects of long-term geographical isolation and combined environmental stresses, including high ultraviolet radiation, low temperatures and oligotrophy, may contribute to shaping the communication and competition strategies of Tibetan Plateau prokaryotes 50 and to creating ecological conditions conducive to the evolution of previously undescribed natural products 51 .
The relationship between BGC coding density and genome size probably reflects the relative priority of secondary metabolism within overall functional allocation 52 . Across most phyla, we observed a significant negative correlation between BGC coding density and genome size, suggesting that secondary metabolic capacity is not passively accumulated during genome expansion but is rather governed by ecological selection and trade-offs in metabolic costs.
In the resource-limited and ecologically intense Plateau environment 50 , key BGCs may be preferentially retained in relatively small genomes due to their adaptive value, resulting in high BGC density within constrained genome architectures. Furthermore, we observed that in addition to the previously reported Myxococcota and Acidobacteriota 8 , 49 , phyla such as Eremiobacteriota, Elusimicrobiota and two uncultured phyla (JAGRBM01 and JAUVQV01) also exhibit substantial biosynthetic potential.
Together, these findings reveal that the Tibetan Plateau microbiota represents an underexplored reservoir of secondary metabolites, while the TEG dataset provides a genomic foundation for their future discovery and characterization. Within the TEG dataset, we characterized 35 CRISPR–Cas subtypes, representing 74% of known global diversity 53 and highlighting the Tibetan Plateau as a fertile ground for gene-editing resource exploration.
Dominant classes included class I, II and III, mirroring the distribution patterns observed in soil 17 , groundwater 54 and deep-sea ecosystems 55 . A total of 216 Cas9 loci, which are key targets for genome engineering 56 , were identified, with pronounced enrichment in Bacteroidota (137 loci) and Pseudomonadota (27 loci).
This lineage-specific clustering corroborates observations from global groundwater surveys 54 . Most identified Cas9 variants were classified as type II-C, which are generally smaller than their II-A, II-B or II-D counterparts and rely on extended base-pairing for target recognition.
The compact nature of type II-C Cas9 makes these systems attractive for tool development, although their cleavage efficiency and off-target effects require empirical characterization 56 . In addition, we identified the versatile Cas12a (Type V-A) system, which possesses multi-substrate nuclease activity towards double-stranded DNA, single-stranded DNA and RNA 57 .
The presence of numerous complete type V loci within Patescibacteria and Nanoarchaeota substantially broadens the evolutionary landscape of these systems. Together, these results highlight uncultivated lineages as important reservoirs of CRISPR diversity 58 and potential sources of next-generation genome editing tools.
The discovery of potentially plastic-degrading enzymes further expands the applied relevance of the TEG resource. Microplastics have been detected in glaciers, lake water, atmospheric depositions and soils across the Tibetan Plateau 59 and are thought to be transported primarily via atmospheric pathways 60 .
Recent studies have identified enzymes from glacial prokaryotes that are capable of degrading PET 23 . From a biotechnological perspective, the widespread detection of plastic-degrading enzyme homologues indicates the presence of a diverse reservoir of esterases and hydrolases with latent plastic-degrading potential, rather than recent, plastic-specific adaptations.
Enzymes derived from extreme and oligotrophic environments are particularly attractive for application, as they often exhibit activity under low-temperature, low-energy or otherwise challenging conditions 18 , 24 . Consistent with this, the identification of plastic-degrading enzymes within the TEG predicted to function under low-temperature (for example, glaciers) or high-temperature (for example, hot springs) conditions highlights their potential utility in distinct biotechnological contexts, including cold-environment bioremediation and high-temperature plastic processing.
Although these conclusions are primarily based on computational predictions and require further experimental validation, the unique enzymatic repertoire uncovered in the TEG represents a valuable and largely unexplored resource. Among the AMPs identified in the TEG through large-scale computational screening and targeted experimental characterization, most sequences lacked homologues in existing public databases, revealing the notable potential of this dataset for discovering previously undescribed AMP resources.
These peptides exhibited strong specificity for particular ecological niches and phylogenetic lineages, consistent with previous multi-ecosystem analyses 16 . This observation suggests that further sampling across underexplored environments is required to access the broader AMP sequence space.
In addition, similar to our observations for BGCs, AMP coding density was negatively correlated with genome size, suggesting that both functional categories may act as energy-efficient molecular weapons mediating microbial interactions and ecological competition. However, inherent limitations of metagenomic techniques, which include incomplete assembly leading to gene loss and bias in genome-size-dependent functional allocation 61 , necessitate validation using cultured isolates.
Notably, experimental validation demonstrated that 29 randomly synthesized candidate peptides exhibited broad-spectrum inhibitory activity against human opportunistic pathogens, as well as phytopathogenic bacteria and fungi. This observation is consistent with the established role of AMPs as multi-target, broad-spectrum antimicrobial molecules 62 .
Compared with conventional antibiotics, AMPs are generally considered less likely to induce rapid resistance due to their non-specific mechanisms of action and the non-mutability of their targets 63 , providing promising new avenues for developing antimicrobial agents with broad-spectrum activity and lower resistance risks for future applications in medicine and agriculture.
In summary, our metagenomic investigation demonstrates that the Tibetan Plateau microbiomes represent a largely untapped reservoir, characterized by an abundance of previously undescribed taxa and a rich source of functional genes, including BGCs, AMPs, CRISPR–Cas systems and plastic-degrading enzymes.
Rather than serving solely as a diversity inventory, the TEG catalogue organizes this previously inaccessible diversity into a systematic, application-oriented genomic resource with direct relevance to biotechnology and medicine. More broadly, the genomic and biotechnological potential revealed here suggest that extreme environments in general, not only the Tibetan Plateau, may serve as reservoirs of adaptive functions and exploitable microbial resources.
In the context of rapidly advancing artificial intelligence (AI) applications in the life sciences, where model performance increasingly depends on the quality and environmental contextualization of foundational data rather than algorithmic complexity alone 64 , 65 , the TEG catalogue represents a valuable resource.
As a large-scale, environment-resolved dataset, the TEG catalogue may support the training and benchmarking of AI models with the potential to enhance functional prediction accuracy and address key data-related limitations in AI-driven biological discovery. Collectively, this resource positions the Tibetan Plateau microbiome as a critical foundation for accelerating natural product discovery, informing innovative antimicrobial strategies and advancing sustainable biotechnological applications aimed at addressing global challenges such as antimicrobial resistance and environmental pollution.
Methods Metagenomic sample collection Overall, 1,698 metagenomic samples were compiled, covering six ecosystems (soil, wetland, lake, river, glacier and hot spring), and encompassing 20 habitats across the Tibetan Plateau (Supplementary Table 1 ). The samples were selected with the aim of covering the major environmental and ecological gradients and representing the heterogeneity of these ecosystems.
The dataset includes 1,128 samples from the Second Tibetan Plateau Scientific Expedition and Research (STEP) program, a national project investigating biodiversity, resources, environment and ecological change on the Tibetan Plateau 66 . Among the STEP samples, 771 were newly sequenced in this study, while 357 have been reported previously 8 , 10 , 67 .
In addition, 570 metagenomes were downloaded from the NCBI Sequence Read Archive (SRA) 68 and the Genome Sequence Archive (GSA) 69 at the National Genomics Data Center (NGDC), China (accessed in June 2024), after filtering based on geographic location within the Tibetan Plateau 70 .
The accession numbers for all samples are provided in Supplementary Table 1 . Soil samples were collected following the standard sampling methods 71 , 72 . For each sample, three random soil cores (5.0-cm diameter, 0–20-cm depth) were collected using a sterilized soil auger within a 1 m 2 area.
The distance between individual cores ranged from 0.3 to 1 m. We ensured composite samples accurately represented the sampling site by selecting locations without obvious soil or vegetation heterogeneity. For wetland soils, aboveground vegetation was removed before sampling and three soil cores were collected from the 0–20 cm layer using the same method and homogenized to generate composite samples.
Lake and river water samples were collected with a 5-litre Schindler sampler. These aquatic samples were prefiltered through a 20-μm sieve (Millipore) to remove large plankton and particles, then passed through a 0.22-μm polycarbonate membrane (47 mm, Millipore), on which microbial cells were retained.
Surface sediments (0–5 cm) of lakes and rivers were collected with grabbers. For glacial samples (for example, surface snow and ice), approximately the upper 5 cm of material was scooped from a 1 m 2 area with a presterilized steel scoop and ice axe, then placed into Whirl-Pak bags (Nasco).
Cryoconites were sampled from cryoconite holes with a stainless-steel scoop and transferred to sterilized 1-litre polycarbonate bottles (Nalgene). Samples were stored at −20 °C for short-term storage before further processing, whereas membrane filters were stored at −80 °C for long-term preservation.
DNA extraction and metagenomic sequencing of in-house samples Terrestrial and wetland soil, lake and river sediment, and cryoconite samples (0.5 g) were incubated in 1.5 ml lysis buffer (20 mg ml −1 Proteinase K, 0.1 M EDTA and 10% SDS) at 55 °C for 2 h before DNA extraction. DNA was extracted using the PowerSoil DNA Isolation Kit (QIAGEN) according to instructions from the manufacturer.
For snow and ice samples, 4 kg of collected material was melted at 10 °C, while 1 litre of water was collected for lake, river and glacial stream samples. All samples were filtered onto a 0.22-μm polycarbonate filter membrane (47-mm diameter, Millipore), and DNA was extracted from the entire filter membrane.
The extracted DNA was eluted with 100 μl of TE buffer and purified using a 1% (w/v) agarose gel. DNA bands were excised from the gel and extracted using an Agarose Gel DNA purification kit (TaKaRa, Japan). The concentration of DNA extracts was measured with a NanoDrop 1000 spectrophotometer (Thermo-Scientific).
Genomic libraries were constructed and sequenced on the MGISEQ-2000RS platform (BGI) at the National Microbiology Data Center, Institute of Microbiology, Chinese Academy of Sciences, with 150-bp paired-end sequencing, followed by standard data processing procedures. An average of 32 Gb of raw sequencing data was generated for all samples, with detailed sequencing statistics summarized in Supplementary Table 1 .
Microbial community profiling To quantify the relative abundances of prokaryotes, eukaryotes and viruses across all samples, taxonomic profiling was performed using Kraken2 (v2.17.1) 73 and Bracken (v3.0.1) 74 against the PlusPF database (Standard plus RefSeq protozoa and fungi, version 2026-02-26 (ref.
75 )) via default parameters. Metagenomic quality control and assembly Raw read quality control was performed using Trim Galore (v0.6.10 (ref. 76 )).
Adaptor sequences were removed, and low-quality bases (Phred quality score <30) were trimmed from the 3’ end. Only paired-end reads with ≥100 bp were retained for subsequent analysis. Clean metagenomic reads were individually assembled with MEGAHIT (v1.1.3) 77 using the default k -mer parameters (--k-list 21, 29, 39, 59, 79, 99, 119, 141), retaining contigs >500 bp.
Raw reads from each sample were aligned to their corresponding per-sample assemblies using Bowtie 2 (v2.3.5.1) 78 with default parameters to calculate the mapping rate. Metagenome binning and genome quality control Metagenomic assemblies of each sample were independently binned using MetaBAT (v2.12.1) 79 , MaxBin2 (v2.2.6) 80 , wrapped in MetaWRAP (v1.3.2) 81 with default parameters.
Moreover, VAMB (v2.0.1) 82 and SemiBin2 (v2.1.0) 83 were used for binning based on deep learning algorithms. Further, MAGScoT 84 was used to score and refine metagenomic bins generated by the above binning tools. To ensure a high-quality and consistent genome-resolved catalogue, contigs and bins of putative eukaryotic origin were excluded from downstream analyses, as reliable recovery of eukaryotic genomes from short-read metagenomic data remains limited 85 , 86 .
Subsequently, to better evaluate the quality of all genomes, including streamlined genomes with reduced genome size and gene content (for example, Patescibacteria and the DPANN superphylum), CheckM2 (v1.0.1) 87 was used to assess the completeness and contamination of the genome bins.
To minimize biases from low-quality genomes, only genomes meeting the empirical Minimum Information about a Metagenome-Assembled Genome medium- or high-quality criteria 88 were retained, yielding 59,730 genomes (medium quality, completeness ≥50% and contamination <10%; high quality, completeness >90%, contamination <5%, with 23S, 16S and 5S rRNA genes and at least 18 tRNAs).
Genome dereplication and generation of species-level SGBs To dereplicate genomes from various samples and binning methods at strain-level, we used a criterion based on isolated cultures, where genomes with an ANI below 99.99% were considered distinct strains 89 . An additional 33,988 previously published MAGs 8 , 9 were integrated with our own data and dereplicated to 51,921 strain-level genomes by dRep (v3.4.5) 90 with the following parameters: -comp 50, -con 10, -sa 0.9999, and --multiround_primary_clustering.
Specifically, the ‘--multiround_primary_clustering’ parameter was used to implement a multi-round clustering approach, which helped reduce the computational burden associated with clustering large-scale genome datasets. Finally, 17,920 representative SGBs were clustered using dRep (v3.4.5) 90 based on a 95% ANI threshold, a widely accepted cutoff for delineating species-level boundaries 4 , 17 , 25 .
Comparison of MAGs and genomes of public databases The representative SGBs were compared to 152,209 publicly available reference genomes, including 21,077 genomes from the SMAG 17 , 18,028 SGBs from the GEM 4 and 113,104 SGBs from the GTDB R22089 . Each reference dataset was compared with our 17,920 SGBs using dRep (v3.4.5) 90 .
A SGB was assigned as a previously undescribed species if it exhibited <95% ANI compared to all reference genomes 8 , 25 . Taxonomic annotation and phylogenetic tree inference Taxonomic annotation of all MAGs was performed using the Genome Taxonomy Database Toolkit (GTDB-Tk, v2.3.2) 91 with the GTDB database release R220 92 , 93 .
Phylogenetic trees were inferred via IQ-TREE (v2.2.0-beta) 94 , using the LG + G amino acid substitution model and 1,000 replicates of bootstrap with parameters: -B 1000, -m LG + G, -wbtl. These analyses were based on the concatenated multiple sequence alignments of 53 archaeal or 120 bacterial universal marker genes 95 generated by GTDB-Tk and trimmed for sequence gaps using trimAl (v1.4.rev15) 96 .
Phylogenetic trees were visualized using iTOL 97 . Profiling of SGB abundances To evaluate whether newly identified SGBs represented dominant or rare biosphere members, species-level quantitative profiling was conducted across all 1,698 metagenomes using Sylph 98 with the 17,920 SGBs as the reference database.
Relative abundance and prevalence were subsequently used to characterize the ecological distribution and habitat specificity of SGBs. Secondary metabolite BGC prediction and classification To reduce the risk of fragmentation 49 , BGCs were predicted only on contigs with ≥5 kb in length using antiSMASH (v7.1.0) 99 , a classic and widely used tool, with default parameters.
Subsequently, BGCs were categorized into gene cluster families (0.3 distance threshold), gene cluster clans (GCCs, 0.7 distance threshold) and classified into ‘Terpene’, ‘NRPS’, ‘RiPP’, ‘PKSI’, ‘PKS–NRPS hybrid’, ‘PKSother’ and ‘Others’, based on the results of the BiG-SCAPE (v1.1.5) 100 with default parameters.
Assessment of BGCs A BGCs was determined to be previously undescribed by querying the 44,719 BGCs against an experimentally validated MIBiG 4.0 28 and a global computationally predicted BGC Atlas (~1.8 million) 29 , using BiG-SLiCE (v2.0.0) 101 with default parameters. The query BGCs with membership scores (L2-normalization-based cosine-like distance) >0.4 in both databases were designated as previously undescribed, following established criteria 49 , 101 .
Correlation between BGC encoding density and genome size To investigate the relationship between BGC encoding density and genome size across different lineages, we selected phyla containing at least 50 genomes for assessment. Genome sizes were corrected based on completeness and contamination estimates from CheckM2 87 , using the following equation 102 : $$\begin{array}{l}\mathrm{Corrected\_genome\_size}=\mathrm{Observed\_genome\_size}\,\times \,100/\mathrm{Completeness}\\\qquad\qquad\qquad\qquad\qquad-\,(\mathrm{Observed\_genome\_size}\,\times \,\mathrm{Contamination}/100)\end{array}$$ and the equation of BGC density 49 : \(\mathrm{BGC\_density}=\,\frac{\mathrm{BGC\_count}}{\mathrm{Corrected\_genome\_size}}.\) Spearman correlation coefficients were computed using the ‘stat_cor’ function from the ggpubr package (v0.6.0) 103 .
Scatter plots of BGC count/density versus corrected genome size were then generated via the ggpmisc package (v0.6.0) 104 , with nonlinear fitting conducted using the locally estimated scatterplot smoothing method and 95% confidence intervals visualized. Prediction and clustering of cAMPs The Macrel (v1.3.0) 32 contigs mode was used to predict cAMPs from 17,920 SGBs.
A customized version of Prodigal (v2.6.3) 105 was used to predict small open reading frames, followed by cAMP prediction based on machine learning. Due to the short length of cAMPs and to avoid spurious matches resulting from short, low-to-medium identity alignments, we adhered to the methodology of Santos-Júnior et al. for clustering cAMPs 16 .
This involved applying thresholds (amino acid identity ≥75%, coverage ≥80% and E -value ≤10− 5 ) using CD-HIT 106 with a reduced amino acid alphabet comprising 8 letters: [LVIMC], [AG], [ST], [FYW], [EDNQ], [KR], [P], [H], thereby reducing sequence redundancy while preserving related peptide families 16 .
The longest sequence within each cluster was selected as the representative. In cases of identical length, sequences were prioritized alphabetically. AMP densities were calculated as the number of AMPs per assembled base pair within a genome.
To evaluate the most promising cAMPs, we predicted the MICs of all cAMPs against 11 common pathogenic or drug-resistant bacterial species using Apex1.1 107 , a deep learning-based tool that has been experimentally validated as highly effective. Overlap analysis between RiPPs and AMPs To evaluate potential redundancy between antiSMASH-predicted RiPPs and Macrel-predicted AMPs, all 95,850 proteins encoded within antiSMASH-predicted RiPP biosynthetic regions (including predictions from contigs shorter than 5 kb) were extracted and indexed using DIAMOND (v2.1.11) 108 .
All cAMPs were used as query sequences against this database under two thresholds: (1) 75% amino acid identity and 30% query coverage (relaxed) and (2) 100% identity and 100% coverage (stringent). Calculation of cAMP physicochemical properties To compute and compare the physicochemical properties of cAMPs, we first downloaded 30,260 experimentally validated sequences from DRAMP 4.0 31 and 1,840 manually curated sequences (920 AMPs and 920 non-AMPs) from the Macrel benchmark dataset 109 .
All physicochemical characteristics of cAMPs, which include molecular weight, amino acid composition, isoelectric point, net charge at pH 7.0, Boman index, instability index and hydrophobicity, were computed using the Peptides package 110 (v2.4.6) in R (v4.3.2). Peptide structures were predicted using ColabFold 111 with default parameters.
Similarity of TEG cAMPs to public databases To compare the similarity of TEG cAMPs to known sequences, we additionally downloaded experimentally validated AMPs from APD 3 (ref. 33 ) and DBAASP 3 (ref. 34 ) along with computationally predicted sequences from AMPSphere (which includes nearly one million previously undescribed cAMPs) 16 .
Following the previous methodology 16 , TEG cAMPs were searched against these public datasets using the ‘easy-search’ method in MMseqs2 (v15.6f452) 112 . Sequences were considered significantly matched when they met the following criteria: amino acid identity ≥75% and E -value ≤10− 5 .
Peptide synthesis and antimicrobial activity assays To validate the antimicrobial potential of the candidates, 30 peptides were selected for chemical synthesis and experimental characterization, with LL-37 serving as a positive control. All AMPs were synthesized by solid-phase peptide synthesis (Sangon Biotech).
The molecular mass of each synthesized peptide was precisely determined by mass spectrometry, and purity was confirmed to exceed 95% for all sequences using high-performance liquid chromatography. Five bacterial and two fungal strains were utilized for activity testing: S. aureus ATCC 25923, S. epidermidis ATCC 12228, E. coli ATCC 4157, P. aeruginosa ATCC 29853, P. syringae ATCC 19875, F. oxysporum ATCC 48112 and F. pseudograminearum zbs1.
Bacterial strains were obtained from the China General Microbiological Culture Collection Center (CGMCC), and fungal strains were provided by the Gansu Academy of Agricultural Sciences. Among these, the first four are common human opportunistic pathogens. P. syringae is a widely distributed phytopathogenic bacterium with a host range encompassing various agricultural and horticultural crops 113 .
F. oxysporum and F. pseudograminearum are critical soil-borne pathogenic fungi; the former is the primary agent of broad-spectrum vascular wilt, while the latter causes cereal crown rot and associated mycotoxin contamination, both impacting agricultural productivity and food safety 114 , 115 .
Antibacterial MICs were determined using a broth microdilution assay following the guidelines of the European Committee on Antimicrobial Susceptibility Testing 116 , with antifungal susceptibility testing adapted from the Clinical and Laboratory Standards Institute M38 117 reference method for filamentous fungi.
Synthesized peptides were dissolved in sterile ultrapure water to a stock concentration of 512 μg ml −1 for subsequent assays. Bacterial strains were cultured in cation-adjusted Mueller–Hinton broth (CAMHB). P. syringae was incubated at its optimal temperature of 25 °C, while the other four bacterial strains were cultured at 37 °C.
After three consecutive passages, cultures were diluted in CAMHB to 1 × 10 6 CFU ml −1 (resulting in a final concentration of approximately 5 × 10 5 CFU ml −1 in 96-well plates). Fungal strains were initially cultured on PDA medium at 25 °C for 7 days. Spores were harvested and suspended in sterile saline.
Following filtration through a sterile Miracloth, the spore concentration was adjusted to 1 × 10 6 spores ml −1 using RPMI 1640 medium buffered with MOPS (pH 7.0) (final concentration of 5 × 10 5 spores ml −1 ). Five experimental groups were established: a blank control (200 μl CAMHB/RPMI 1640), a growth control (100 μl CAMHB/RPMI 1640 + 100 μl inoculum), a peptide background control (100 μl CAMHB/RPMI 1640 + 100 μl peptide), a positive control (100 μl LL-37 + 100 μl inoculum) and the experimental groups (100 μl peptide + 100 μl inoculum).
A twofold serial dilution method was used, with peptide concentrations ranging from 1 to 256 μg ml −1 . The MIC was defined as the lowest peptide concentration at which no visible bacterial growth was observed or fungal growth was ≥50% inhibited compared to the growth control. All assays were performed in three independent biological replicates.
For all experimental groups, the optical density values were corrected by subtracting the corresponding peptide background values to eliminate the interference of the peptides and media on absorbance measurements. Genome mining of CRISPR–Cas systems CRISPR–Cas genes and arrays in 17,920 SGBs were identified using CRISPRCasTyper (v1.8.0) 53 with default parameters.
In short, it detects Cas operons via HMM scoring and CRISPR arrays through repeat homology/machine learning-based subtype prediction. CRISPR–Cas systems were classified as complete when both adaptation and interference modules achieved 100% completeness. Proteins starting with the initiation codon and ending with the termination codon were defined as complete proteins.
To compare the sequence similarity between these Cas proteins and known proteins, we downloaded 830 Cas9 proteins from CasPEDIA 118 and performed the comparison with an E-value cutoff of 1 × 10 −5 (ref. 108 ). Complete Cas9 proteins were used for phylogenetic tree construction.
First, multiple sequence alignment was performed using MUSCLE (v5.1) 119 . Second, alignment gaps were eliminated using trimAl (v1.4.rev15) 96 with parameters: -gt 0.95 -cons 50. Finally, the optimal model was automatically selected under the ‘-MFP’ option in IQ-TREE (v2.2.0-beta) 94 for tree construction.
Screening for plastic-degrading homologues To investigate the plastic degradation potential of the TEG, we used DIAMOND (v2.1.11) 108 to identify homologues against the PlasticDB 41 collection of 219 experimentally verified plastic-degrading enzymes, using an E -value threshold of 1 × 10 −5 (ref.
15 ). The count of plastic degradation-associated genes in each MAG was normalized to genome size. Of these, 812 sequences met the thresholds of ≥75% amino acid identity and ≥80% query coverage, representing candidates with the highest potential for plastic degradation 42 .
Identification of PETase sequences from the TEG Each putative PET hydrolase (PETase) homologue identified in the previous step was aligned against the reference PET hydrolase IsPETase (GenBank: GAP38373.1) 120 using MUSCLE (v5.1) 119 . Sequences were screened for the catalytic triad (Ser-Asp-His) and the conserved motif G158-X-S160-X-G162 via an in-house Python script.
Then, SignalP (v6.0) 121 identified signal peptides in all candidates by choosing ‘Other’ organism and ‘Fast’ model, with retention restricted to signal peptide-containing sequences. Candidate sequences, including the catalytic triad and signal peptides, were subjected to MUSCLE (v5.1) 119 alignment followed by IQ-TREE (v2.2.0-beta) 94 using ‘-MFP’ option, which identified pfam+I + R10 as the best-fit model for phylogenetic construction.
The optimal temperature ( T opt ), melting temperature ( T m ) and optimal pH (pH opt ) of all candidate enzymes were predicted via deep learning using Seq2Topt 122 . For MAGs, optimal growth temperatures were predicted with Tome (v1.0.0) 123 . All protein structures were predicted using ESMFold (v1.0.3) 44 with default parameters.
To evaluate the functional activity of the candidate proteins, the crystal structure of an engineered Ca PETase M9 variant 45 (accession ID: 7YME) was retrieved from the PDB database. This variant exhibits a T m of 83.2 °C and demonstrates high hydrolytic activity at 60 °C. Subsequently, all predicted protein structures were aligned against 7YME by TM-align 46 .
Three-dimensional structures from the resulting PDB files were visualized using PyMOL (v3.1.0) ( https://pymol.org ). Statistics and reproducibility All statistical analyses were conducted in R (v4.3.2) 124 using RStudio. Pie, bar, box, violin and heat map plots were created with ggplot2 (v3.5.1) 125 .
Figure 1a was generated using the R package maps (v3.4.2) 126 . Differences among groups were assessed using the non-parametric Kruskal–Wallis rank-sum test, followed by post hoc multiple comparisons using the ‘kruskalmc’ procedure implemented in the ‘geom_tukey’ function of the R package ggtukey (v0.4.0) 127 .
Rain cloud plots and boxplots were used to visualize data distributions via the following components: the box denotes the interquartile range (IQR), with a central line representing the median; whiskers extend to the extreme values within 1.5× IQR of the box hinges; outliers falling outside this range were plotted as individual points.
Where appropriate, raw data points were overlaid on bar plots and violin plots to illustrate the distributions. Compact letter displays were used to summarize pairwise comparisons, with different letters indicating significant differences at α = 0.05. Reporting summary Further information on research design is available in the Nature Portfolio Reporting Summary linked to this article.
Data availability The 771 metagenomic raw sequencing data generated in this study have been deposited in the Genome Sequence Archive (GSA) section of the National Genomics Data Center under BioProject: PRJCA048287 (GSA accession code: CRA034867 , CRA034868 and CRA035435 ). All the MAGs, functional gene catalogues predicted by the TEG, ESMFold-predicted PDB files and the source data underlying Figs.
1 – 6 , Extended Data Figs. 1 – 10 , Supplementary Tables 1 – 10 and Supplementary Data 1 – 3 are available via Zenodo at https://doi.org/10.5281/zenodo.20744830 (ref. 128 ).
The databases used in this study include the GEM catalogue ( https://genome.jgi.doe.gov/portal/GEMs/GEMs.home.html ), the SMAG ( https://doi.org/10.5281/zenodo.8223844 ), the GTDB database Release 220 ( https://data.ace.uq.edu.au/public/gtdb/data/releases/release220 ), the MIBiG 4.0 ( https://mibig.secondarymetabolites.org ), the BGC Atlas ( https://bgc-atlas.cs.uni-tuebingen.de ), the DRAMP 4.0 ( http://dramp.cpu-bioinfor.org ), APD 3 ( https://aps.unmc.edu/home ), DBAASP 3 ( https://www.dbaasp.org/home) , AMPSphere ( https://ampsphere.big-data-biology.org/home ) and the PlasticDB ( https://plasticdb.org ).
Code availability All analysis code used in this study is publicly available via GitHub at https://github.com/neptuneyt/TEG . Additional data required to reanalyse the findings are available from the lead contact upon request. References Schleifer, K.-H.
Microbial diversity: facts, problems and prospects. Syst. Appl.
Microbiol. 27 , 3–9 (2004). Article PubMed Google Scholar Whitman, W.
B., Coleman, D. C. & Wiebe, W. J.
Prokaryotes: the unseen majority. Proc. Natl Acad.
Sci. USA 95 , 6578–6583 (1998). Article CAS PubMed PubMed Central Google Scholar Planes, S. & Allemand, D.
Insights and achievements from the Tara Pacific expedition. Nat. Commun.
14 , 3131 (2023). Article CAS PubMed PubMed Central Google Scholar Nayfach, S. et al. A genomic catalog of Earth’s microbiomes.
Nat. Biotechnol. 39 , 499–509 (2021).
Article CAS PubMed Google Scholar Xiao, X., Wang, J. & Ding, K. MEER: extraordinary flourishing ecosystem in the deepest ocean. Cell 188 , 1175–1177 (2025).
Article CAS PubMed Google Scholar Ding, L. et al. Timing and mechanisms of Tibetan Plateau uplift. Nat.
Rev. Earth Environ. 3 , 652–667 (2022).
Article Google Scholar Yang, Z. et al. Genetic adaptation of skin pigmentation in highland Tibetans. Proc.
Natl Acad. Sci. USA 119 , e2200421119 (2022).
Article CAS PubMed PubMed Central Google Scholar Liu, Y. et al. A genome and gene catalog of glacier microbiomes. Nat.
Biotechnol. 40 , 1341–1348 (2022). Article PubMed Google Scholar Cheng, M. et al.
A genome and gene catalog of the aquatic microbiomes of the Tibetan Plateau. Nat. Commun.
15 , 1438 (2024). Article CAS PubMed PubMed Central Google Scholar Feng, X. et al. Functional traits and adaptation of lake microbiomes on the Tibetan Plateau.
Microbiome 12 , 264 (2024). Article PubMed PubMed Central Google Scholar Xu, M. et al. High microbial diversity stabilizes the responses of soil organic carbon decomposition to warming in the subsoil on the Tibetan Plateau.
Glob. Chang. Biol.
27 , 2061–2075 (2021). Article CAS PubMed Google Scholar Yao, T. et al. Recent Third Pole’s rapid warming accompanies cryospheric melt and water cycle intensification and interactions between monsoon and environment: multidisciplinary approach with observations, modeling, and analysis.
Bull. Am. Meteorol.
Soc. 100 , 423–444 (2019). Article Google Scholar Cauvy-Fraunié, S. & Dangles, O.
A global synthesis of biodiversity responses to glacier retreat. Nat. Ecol.
Evol. 3 , 1675–1685 (2019). Article PubMed Google Scholar Stibal, M. et al.
Glacial ecosystems are essential to understanding biodiversity responses to glacier retreat. Nat. Ecol.
Evol. 4 , 686–687 (2020). Article PubMed Google Scholar Chen, J. et al.
Global marine microbial diversity and its potential in bioprospecting. Nature 633 , 371–379 (2024). Article CAS PubMed PubMed Central Google Scholar Santos-Júnior, C.
D. et al. Discovery of antimicrobial peptides in the global microbiome with machine learning. Cell 187 , 3761–3778 (2024).
Article PubMed PubMed Central Google Scholar Ma, B. et al. A genomic catalogue of soil microbiomes boosts mining of biodiversity and genetic resources. Nat.
Commun. 14 , 7318 (2023). Article CAS PubMed PubMed Central Google Scholar Shu, W.-S. & Huang, L.-N.
Microbial diversity in extreme environments. Nat. Rev.
Microbiol. 20 , 219–235 (2022). Article CAS PubMed Google Scholar Margesin, R. & Collins, T.
Microbial ecology of the cryosphere (glacial and permafrost habitats): current knowledge. Appl. Microbiol.
Biotechnol. 103 , 2537–2549 (2019). Article CAS PubMed PubMed Central Google Scholar Qian, Y.-F., Yu, J.-Y., Xie, J. & Yang, S.-P.
A mini-review on cold-adapted enzymes from psychrotrophic microorganisms in foods: benefits and challenges. Curr. Res.
Biotechnol. 6 , 100162 (2023). Article CAS Google Scholar Vechtomova, Y.
L., Telegina, T. A., Buglak, A. A. & Kritsky, M.
S. UV radiation in DNA damage and repair involving DNA-photolyases and cryptochromes. Biomedicines 9 , 1564 (2021).
Article CAS PubMed PubMed Central Google Scholar Xu, Q. et al. Carbon starvation raises capacities in bacterial antibiotic resistance and viral auxiliary carbon metabolism in soils. Proc.
Natl Acad. Sci. USA 121 , e2318160121 (2024).
Article CAS PubMed PubMed Central Google Scholar Qi, X., Ji, M., Yin, C.-F., Zhou, N.-Y. & Liu, Y. Glacier as a source of novel polyethylene terephthalate hydrolases. Environ.
Microbiol. 25 , 2822–2833 (2023). Article CAS PubMed Google Scholar Liszka, M.
J., Clark, M. E., Schneider, E. & Clark, D. S.
Nature versus nurture: developing enzymes that function under extreme conditions. Annu. Rev.
Chem. Biomol. Eng.
3 , 77–102 (2012). Article CAS PubMed Google Scholar Jain, C., Rodriguez-R, L. M., Phillippy, A.
M., Konstantinidis, K. T. & Aluru, S. High throughput ANI analysis of 90 K prokaryotic genomes reveals clear species boundaries.
Nat. Commun. 9 , 5114 (2018).
Article PubMed PubMed Central Google Scholar Pasolli, E. et al. Extensive unexplored human microbiome diversity revealed by over 150,000 genomes from metagenomes spanning age, geography, and lifestyle. Cell 176 , 649–662 (2019).
Article CAS PubMed PubMed Central Google Scholar Yu, T. et al. Global marine cold seep metagenomes reveal diversity of taxonomy, metabolic function, and natural products. Genom.
Proteom. Bioinform. 22 , qzad006 (2024).
Article CAS Google Scholar Zdouc, M. M. et al. MIBiG 4.0: advancing biosynthetic gene cluster curation through global collaboration.
Nucleic Acids Res. 53 , D678–D690 (2025). Article CAS PubMed PubMed Central Google Scholar Bağcı, C. et al.
BGC atlas: a web resource for exploring the global chemical diversity encoded in bacterial genomes. Nucleic Acids Res. 53 , D618–D624 (2025).
Article PubMed PubMed Central Google Scholar Süssmuth, R. D. & Mainz, A. Nonribosomal peptide synthesis—principles and prospects.
Angew. Chem. Int.
Ed. 56 , 3770–3821 (2017). Article Google Scholar Ma, T. et al.
DRAMP 4.0: an open-access data repository dedicated to the clinical translation of antimicrobial peptides. Nucleic Acids Res. 53 , D403–D410 (2025).
Article CAS PubMed PubMed Central Google Scholar Santos-Júnior, C. D., Pan, S., Zhao, X.-M. & Coelho, L. P.
Macrel: antimicrobial peptide screening in genomes and metagenomes. PeerJ 8 , e10555 (2020). Article PubMed PubMed Central Google Scholar Wang, G., Li, X. & Wang, Z.
APD3: the antimicrobial peptide database as a tool for research and education. Nucleic Acids Res. 44 , D1087–D1093 (2016).
Article CAS PubMed Google Scholar Pirtskhalava, M. et al. DBAASP v3: database of antimicrobial/cytotoxic activity and structure of peptides as a resource for development of new therapeutics. Nucleic Acids Res.
49 , D288–D297 (2021). Article CAS PubMed PubMed Central Google Scholar Wang, J. Y. & Doudna, J.
A. CRISPR technology: a decade of genome editing is only the beginning. Science 379 , eadd8643 (2023).
Article CAS PubMed Google Scholar Johansson, J., Gudmundsson, G. H., Rottenberg, M. E., Berndt, K.
D. & Agerberth, B. Conformation-dependent antibacterial activity of the naturally occurring human peptide LL-37*. J.
Biol. Chem. 273 , 3718–3724 (1998).
Article CAS PubMed Google Scholar Wang, H. et al. Antifungal peptide P852 effectively controls Fusarium oxysporum , a wilt-causing fungus, by affecting the glucose metabolism and amino acid metabolism as well as damaging mitochondrial function. J.
Agric. Food Chem. 71 , 19638–19651 (2023).
Article CAS PubMed Google Scholar Lu, J. et al. Antimicrobial mechanisms and antifungal activity of compounds generated by banana rhizosphere Pseudomonas aeruginosa Gxun-2 against Fusarium oxysporum f. sp. cubense . Front.
Microbiol. 15 , 1456847 (2024). Article CAS PubMed PubMed Central Google Scholar Meaden, S. et al.
High viral abundance and low diversity are associated with increased CRISPR–Cas prevalence across microbial ecosystems. Curr. Biol.
32 , 220–227 (2022). Article CAS PubMed Google Scholar Roux, S. et al. Planetary-scale metagenomic analysis reveals CRISPR targeting dynamics across ecosystems.
Nat. Microbiol. https://doi.org/10.1038/s41564-026-02480-7 (2026). Gambarini, V. et al.
PlasticDB: a database of microorganisms and proteins linked to plastic biodegradation. Database 2022 , baac008 (2022). Article CAS PubMed PubMed Central Google Scholar Tian, W. & Skolnick, J.
How well is enzyme function conserved as a function of pairwise sequence identity? J. Mol.
Biol. 333 , 863–882 (2003). Article CAS PubMed Google Scholar Qiu, J. et al.
A comprehensive review on enzymatic biodegradation of polyethylene terephthalate. Environ. Res.
240 , 117427 (2024). Article CAS PubMed Google Scholar Lin, Z. et al. Evolutionary-scale prediction of atomic-level protein structure with a language model.
Science 379 , 1123–1130 (2023). Article CAS PubMed Google Scholar Hong, H. et al. Discovery and rational engineering of PET hydrolase with both mesophilic and thermophilic PET hydrolase properties.
Nat. Commun. 14 , 4556 (2023).
Article CAS PubMed PubMed Central Google Scholar Zhang, Y. & Skolnick, J. TM-align: a protein structure alignment algorithm based on the TM-score. Nucleic Acids Res.
33 , 2302–2309 (2005). Article CAS PubMed PubMed Central Google Scholar Kang, L. et al. Metagenomic insights into microbial community structure and metabolism in alpine permafrost on the Tibetan Plateau.
Nat. Commun. 15 , 5920 (2024).
Article CAS PubMed PubMed Central Google Scholar Geers, A. U. et al. Deciphering the biosynthetic landscape of biofilms in glacier-fed streams. mSystems 10 , e01137–24 (2024).
PubMed PubMed Central Google Scholar Paoli, L. et al. Biosynthetic potential of the global ocean microbiome. Nature 607 , 111–118 (2022).
Article CAS PubMed PubMed Central Google Scholar Feng, J. et al. Soil microbial trait-based strategies drive metabolic efficiency along an altitude gradient. ISME Commun.
1 , 71 (2021). Article PubMed PubMed Central Google Scholar Basnet, B. B., Zhou, Z.-Y., Basnet, R., Wei, B. & Wang, H.
Advances in natural product discovery: strategies, technologies, and insights. Nat. Prod.
Bioprospect. 16 , 3 (2026). Article CAS PubMed PubMed Central Google Scholar Jensen, P.
R. Natural products and the gene cluster revolution. Trends Microbiol.
24 , 968–977 (2016). Article CAS PubMed PubMed Central Google Scholar Russel, J., Pinilla-Redondo, R., Mayo-Muñoz, D., Shah, S. A. & Sørensen, S.
J. CRISPRCasTyper: automated identification, annotation, and classification of CRISPR–Cas loci. CRISPR J.
3 , 462–469 (2020). Article CAS PubMed Google Scholar Deng, C., Hu, J., Chen, Q., Zhou, S. & Ni, J. Expanded global groundwater microbial diversity reveals bioprospecting potential.
Cell Rep. 45 , 116760 (2026). Article CAS PubMed Google Scholar Sánchez, P. et al.
Widespread and abundant CRISPR–Cas systems in the deep ocean. Preprint at bioRxiv https://doi.org/10.1101/2025.05.26.656144 (2025). Mir, A., Edraki, A., Lee, J. & Sontheimer, E.
J. Type II-C CRISPR–Cas9 biology, mechanism, and application. ACS Chem.
Biol. 13 , 357–365 (2018). Article CAS PubMed Google Scholar Pan, J. et al.
Kinetic analysis and engineering of thermostable Cas12a for nucleic acid detection. Nucleic Acids Res. 53 , gkaf509 (2025).
Article CAS PubMed PubMed Central Google Scholar Yan, W. X. et al. Functionally diverse type V CRISPR–Cas systems.
Science 363 , 88–91 (2019). Article CAS PubMed Google Scholar Wang, T. et al. Microplastic pollution characteristics and its future perspectives in the Tibetan Plateau.
J. Hazard. Mater.
457 , 131711 (2023). Article CAS PubMed Google Scholar Zhang, Y. et al. Microplastics in glaciers of the Tibetan Plateau: evidence for the long-range transport of microplastics.
Sci. Total Environ. 758 , 143634 (2021).
Article CAS PubMed Google Scholar Ghurye, J. S., Cepeda-Espinoza, V. & Pop, M. Metagenomic assembly: overview, challenges and applications.
Yale J. Biol. Med.
89 , 353–362 (2016). CAS PubMed PubMed Central Google Scholar Oliveira Júnior, N. G., Souza, C.
M., Buccini, D. F., Cardoso, M. H. & Franco, O.
L. Antimicrobial peptides: structure, functions and translational applications. Nat.
Rev. Microbiol. 23 , 687–700 (2025).
Article PubMed Google Scholar Mookherjee, N., Anderson, M. A., Haagsman, H. P. & Davidson, D.
J. Antimicrobial host defence peptides: functions and clinical potential. Nat.
Rev. Drug Discov. 19 , 311–332 (2020).
Article CAS PubMed Google Scholar National Academies of Sciences, Engineering, and Medicine Importance of data in AI-enabled biological models. In The Age of AI in the Life Sciences: Benefits and Biosecurity Considerations 64–84 (National Academies Press, 2025). Ektefaie, Y. et al.
Evaluating generalizability of artificial intelligence models for molecular datasets. Nat. Mach.
Intell. 6 , 1512–1524 (2024). Article Google Scholar Yao, T. et al.
The second tibetan plateau scientific expedition and research to serve construction of ecological civilization highland. Bull. Chin.
Acad. Sci. 36 , 17–28 (2024).
Google Scholar Adyari, B. et al. Anthropogenic gene dissemination in Tibetan Plateau rivers: sewage-driven spread, environmental selection, and microeukaryotic inter-trophic driving factors. Water Res.
284 , 123887 (2025). Article CAS PubMed Google Scholar Katz, K. et al. The sequence read archive: a decade more of explosive growth.
Nucleic Acids Res. 50 , D387–D390 (2022). Article CAS PubMed PubMed Central Google Scholar Chen, T. et al.
The genome sequence archive family: toward explosive data growth and diverse data types. Genom. Proteom.
Bioinform. 19 , 578–583 (2021). Article Google Scholar Liu, J. et al.
Name and scale matter: clarifying the geography of Tibetan Plateau and adjacent mountain regions. Glob. Planet.
Change 215 , 103893 (2022). Article Google Scholar Carter, M. R. & Gregorich, E.
G. Soil Sampling and Methods of Analysis https://doi.org/10.1201/9781420005271 (CRC Press, 2007). Zeng, Y. et al.
Regional microbial biogeography linked to soil respiration. Sci. Total Environ.
929 , 172263 (2024). Article CAS PubMed Google Scholar Lu, J. et al. Metagenome analysis using the Kraken software suite.
Nat. Protoc. 17 , 2815–2839 (2022).
Article CAS PubMed PubMed Central Google Scholar Lu, J., Breitwieser, F. P., Thielen, P. & Salzberg, S. L.
Bracken: estimating species abundance in metagenomics data. PeerJ Comput. Sci.
3 , e104 (2017). Article PubMed PubMed Central Google Scholar Langmead, B. Kraken 2, KrakenUniq and Bracken indexes.
GitHub https://benlangmead.github.io/aws-indexes/k2 (2026). Trim Galore (Babraham Institute, 2015); https://www.bioinformatics.babraham.ac.uk/projects/trim_galore Li, D., Liu, C.-M., Luo, R., Sadakane, K. & Lam, T.-W. MEGAHIT: an ultra-fast single-node solution for large and complex metagenomics assembly via succinct de Bruijn graph.
Bioinformatics 31 , 1674–1676 (2015). Article CAS PubMed Google Scholar Langmead, B. & Salzberg, S. L.
Fast gapped-read alignment with Bowtie 2. Nat. Methods 9 , 357–359 (2012).
Article CAS PubMed PubMed Central Google Scholar Kang, D. D. et al. MetaBAT 2: an adaptive binning algorithm for robust and efficient genome reconstruction from metagenome assemblies.
PeerJ 7 , e7359 (2019). Article PubMed PubMed Central Google Scholar Wu, Y.-W., Simmons, B. A. & Singer, S.
W. MaxBin 2.0: an automated binning algorithm to recover genomes from multiple metagenomic datasets. Bioinformatics 32 , 605–607 (2016).
Article CAS PubMed Google Scholar Uritskiy, G. V., DiRuggiero, J. & Taylor, J. MetaWRAP—a flexible pipeline for genome-resolved metagenomic data analysis.
Microbiome 6 , 158 (2018). Article PubMed PubMed Central Google Scholar Nissen, J. N. et al.
Improved metagenome binning and assembly using deep variational autoencoders. Nat. Biotechnol.
39 , 555–560 (2021). Article CAS PubMed Google Scholar Pan, S., Zhu, C., Zhao, X.-M. & Coelho, L. P.
A deep siamese neural network improves metagenome-assembled genomes in microbiome datasets across different environments. Nat. Commun.
13 , 2326 (2022). Article CAS PubMed PubMed Central Google Scholar Rühlemann, M. C., Wacker, E.
M., Ellinghaus, D. & Franke, A. MAGScoT: a fast, lightweight and accurate bin-refinement tool. Bioinformatics 38 , 5430–5433 (2022).
Article PubMed PubMed Central Google Scholar Lynch, M. & Conery, J. S. The origins of genome complexity.
Science 302 , 1401–1404 (2003). Article CAS PubMed Google Scholar Saraiva, J. P., Bartholomäus, A., Toscan, R.
B., Baldrian, P. & Nunes da Rocha, U. Recovery of 197 eukaryotic bins reveals major challenges for eukaryote genome reconstruction from terrestrial metagenomes. Mol.
Ecol. Resour. 23 , 1066–1076 (2023).
Article CAS PubMed Google Scholar Chklovski, A., Parks, D. H., Woodcroft, B. J. & Tyson, G.
W. CheckM2: a rapid, scalable and accurate tool for assessing microbial genome quality using machine learning. Nat.
Methods 20 , 1203–1212 (2023). Article CAS PubMed Google Scholar Bowers, R. M. et al.
Minimum information about a single amplified genome (MISAG) and a metagenome-assembled genome (MIMAG) of bacteria and archaea. Nat. Biotechnol.
35 , 725–731 (2017). Article CAS PubMed PubMed Central Google Scholar Viver, T. et al. Towards estimating the number of strains that make up a natural bacterial population.
Nat. Commun. 15 , 544 (2024).
Article CAS PubMed PubMed Central Google Scholar Olm, M. R., Brown, C. T., Brooks, B. & Banfield, J.
F. dRep: a tool for fast and accurate genomic comparisons that enables improved genome recovery from metagenomes through de-replication. ISME J. 11 , 2864–2868 (2017).
Article CAS PubMed PubMed Central Google Scholar Chaumeil, P.-A., Mussig, A. J., Hugenholtz, P. & Parks, D. H.
GTDB-Tk: a toolkit to classify genomes with the Genome Taxonomy Database. Bioinformatics 36 , 1925–1927 (2020). Article CAS Google Scholar Parks, D.
H. et al. GTDB: an ongoing census of bacterial and archaeal diversity through a phylogenetically consistent, rank normalized and complete genome-based taxonomy. Nucleic Acids Res.
50 , D785–D794 (2022). Article CAS PubMed PubMed Central Google Scholar Release 220 statistics. GTDB https://gtdb.ecogenomic.org/stats/r220 (2024).
Minh, B. Q. et al. IQ-TREE 2: new models and efficient methods for phylogenetic inference in the genomic era.
Mol. Biol. Evol.
37 , 1530–1534 (2020). Article CAS PubMed PubMed Central Google Scholar Parks, D. H. et al.
GTDB release 10: a complete and systematic taxonomy for 715 230 bacterial and 17 245 archaeal genomes. Nucleic Acids Res. 54 , D743–D754 (2026).
Article PubMed PubMed Central Google Scholar Capella-Gutiérrez, S., Silla-Martínez, J. M. & Gabaldón, T. trimAl: a tool for automated alignment trimming in large-scale phylogenetic analyses. Bioinformatics 25 , 1972–1973 (2009).
Article PubMed PubMed Central Google Scholar Letunic, I. & Bork, P. Interactive tree of life (iTOL) v6: recent updates to the phylogenetic tree display and annotation tool. Nucleic Acids Res.
52 , W78–W82 (2024). Article PubMed PubMed Central Google Scholar Shaw, J. & Yu, Y. W.
Rapid species-level metagenome profiling and containment estimation with sylph. Nat. Biotechnol.
43 , 1348–1359 (2025). Article CAS PubMed Google Scholar Blin, K. et al. antiSMASH 7.0: new and improved predictions for detection, regulation, chemical structures and visualisation. Nucleic Acids Res.
51 , W46–W50 (2023). Article CAS PubMed PubMed Central Google Scholar Navarro-Muñoz, J. C. et al.
A computational framework to explore large-scale biosynthetic diversity. Nat. Chem.
Biol. 16 , 60–68 (2020). Article PubMed Google Scholar Draisma, A. et al.
BiG-SCAPE 2.0 and BiG-SLiCE 2.0: scalable, accurate and interactive sequence clustering of metabolic gene clusters. Nat. Commun.
17 , 2000 (2026). Article CAS PubMed PubMed Central Google Scholar Nayfach, S., Shi, Z. J., Seshadri, R., Pollard, K.
S. & Kyrpides, N. C. New insights from uncultivated genomes of the global human gut microbiome.
Nature 568 , 505–510 (2019). Article CAS PubMed PubMed Central Google Scholar Kassambara, A. Ggpubr: ‘ggplot2’ based publication ready plots.
R package version 0.6.0 https://CRAN.R-project.org/package=ggpubr (2023). Aphalo, P. J.
Ggpmisc: miscellaneous extensions to ‘Ggplot2’. R package version 0.6.0 https://CRAN.R-project.org/package=ggpmisc (2024). Hyatt, D. et al.
Prodigal: prokaryotic gene recognition and translation initiation site identification. BMC Bioinform. 11 , 119 (2010).
Article Google Scholar Fu, L., Niu, B., Zhu, Z., Wu, S. & Li, W. CD-HIT: accelerated for clustering the next-generation sequencing data. Bioinformatics 28 , 3150–3152 (2012).
Article CAS PubMed PubMed Central Google Scholar Torres, M. D. T., Wan, F. & de la Fuente-Nunez, C.
Deep learning reveals antibiotics in the archaeal proteome. Nat. Microbiol.
10 , 2153–2167 (2025). Article CAS PubMed PubMed Central Google Scholar Buchfink, B., Reuter, K. & Drost, H.-G. Sensitive protein alignments at tree-of-life scale using DIAMOND.
Nat. Methods 18 , 366–368 (2021). Article CAS PubMed PubMed Central Google Scholar Xiao, X., Wang, P., Lin, W.-Z., Jia, J.-H. & Chou, K.-C. iAMP-2L: a two-level multi-label classifier for identifying antimicrobial peptides and their functional types.
Anal. Biochem. 436 , 168–177 (2013).
Article CAS PubMed Google Scholar Osorio, D., Rondón-Villarreal, P. & Torres, R. Peptides: a package for data mining of antimicrobial peptides. R J.
7 , 4–14 (2015). Article Google Scholar Mirdita, M. et al. ColabFold: making protein folding accessible to all.
Nat. Methods 19 , 679–682 (2022). Article CAS PubMed PubMed Central Google Scholar Steinegger, M. & Söding, J.
MMseqs2 enables sensitive protein sequence searching for the analysis of massive data sets. Nat. Biotechnol.
35 , 1026–1028 (2017). Article CAS PubMed Google Scholar O’Brien, H. E., Thakur, S. & Guttman, D.
S. Evolution of plant pathogenesis in Pseudomonas syringae : a genomics perspective. Annu.
Rev. Phytopathol. 49 , 269–289 (2011).
Article PubMed Google Scholar Michielse, C. B. & Rep, M. Pathogen profile update: Fusarium oxysporum .
Mol. Plant Pathol. 10 , 311–324 (2009).
Article CAS PubMed PubMed Central Google Scholar Kazan, K. & Gardiner, D. M. Fusarium crown rot caused by Fusarium pseudograminearum in cereal crops: recent progress and future prospects.
Mol. Plant Pathol. 19 , 1547–1562 (2018).
Article CAS PubMed PubMed Central Google Scholar Giske, C. G., Turnidge, J., Cantón, R., Kahlmeter, G. & EUCAST Steering Committee Update from the European Committee on Antimicrobial Susceptibility Testing (EUCAST). J.
Clin. Microbiol . 60 , e0027621 (2022).
Wiederhold, N. P. Antifungal susceptibility of yeasts and filamentous fungi by CLSI broth microdilution testing.
Methods Mol. Biol. 2658 , 3–16 (2023).
Article CAS PubMed Google Scholar Adler, B. A. et al. CasPEDIA database: a functional classification system for class 2 CRISPR–Cas enzymes.
Nucleic Acids Res. 52 , D590–D596 (2024). Article CAS PubMed PubMed Central Google Scholar Edgar, R.
C. Muscle5: high-accuracy alignment ensembles enable unbiased assessments of sequence homology and phylogeny. Nat.
Commun. 13 , 6968 (2022). Article CAS PubMed PubMed Central Google Scholar Yoshida, S. et al.
A bacterium that degrades and assimilates poly(ethylene terephthalate). Science 351 , 1196–1199 (2016). Article CAS PubMed Google Scholar Teufel, F. et al.
SignalP 6.0 predicts all five types of signal peptides using protein language models. Nat. Biotechnol.
40 , 1023–1025 (2022). Article CAS PubMed PubMed Central Google Scholar Qiu, S., Hu, B., Zhao, J., Xu, W. & Yang, A. Seq2Topt: a sequence-based deep learning predictor of enzyme optimal temperature.
Brief. Bioinform. 26 , bbaf114 (2025).
Article CAS PubMed PubMed Central Google Scholar Li, G., Rabe, K. S., Nielsen, J. & Engqvist, M. K.
M. Machine learning applied to predicting microorganism growth temperatures and enzyme catalytic optima. ACS Synth.
Biol. 8 , 1411–1420 (2019). Article CAS PubMed Google Scholar R Core Team R: A Language and Environment for Statistical Computing (R Foundation for Statistical Computing, 2020); https://www.r-project.org Wickham, H.
Ggplot2: Elegant Graphics for Data Analysis (Springer, 2009). Becker, R. & Wilks, A. maps: draw geographical maps. Github https://github.com/adeckmyn/maps (2023).
Bass, E. ggtukey: compact letter displays for ‘ggplot2’. https://ethanbass.github.io/ggtukey (2023). Liu, Y., Yu, T. & Ji, M. Mapping the microbiome on the Tibetan Plateau for bioprospecting.
Zenodo https://doi.org/10.5281/zenodo.20744830 (2026). Download references Acknowledgements We thank H. Yu from the Gansu Academy of Agricultural Sciences for kindly providing the fungal strains.
We also acknowledge the Supercomputing Center of Lanzhou University for computing resources. Funding This study was financially supported by the following funding: National Natural Science Foundation of China (grant no. 42421001, 42425607, 42406261), the Second Tibetan Plateau Scientific Expedition and Research Program (STEP) (2024QZKK0201), Natural Science Foundation of Gansu Province, China (grant no.
25JRRA699, 23ZDKA0008), and the Royal Society Sino-British Fellowship Trust International Exchanges Award (IEC\NSFC\252940). Author information Author notes These authors contributed equally: Yongqin Liu, Tao Yu. Authors and Affiliations Center for Pan-third Pole Environment, Lanzhou University, Lanzhou, China Yongqin Liu, Tao Yu, Mukan Ji, Pengfei Liu & Guannan Mao State Key Laboratory of Tibetan Plateau Earth System, Environment and Resources, Institute of Tibetan Plateau Research, Chinese Academy of Sciences, Beijing, China Yongqin Liu & Xuliang Zhuang Key Laboratory of Pan-third Pole Biogeochemical Cycling, Lanzhou, China Tao Yu, Mukan Ji, Pengfei Liu & Guannan Mao Chayu Integrated Observation and Research Station of the Xizang Autonomous Region, Nyingchi, China Tao Yu, Mukan Ji, Pengfei Liu & Guannan Mao River Ecosystems Laboratory, Alpine and Polar Environmental Research Center, ENAC, Ecole Polytechnique Fédérale de Lausanne, Sion, Switzerland Tom J.
Battin School of Biological Sciences, University of Southampton, Southampton, UK Marc G. Dumont Tsinghua Shenzhen International Graduate School, Shenzhen, China Yunfeng Yang Key Laboratory of Lake and Watershed Science for Water Security, Nanjing Institute of Geography and Limnology, Chinese Academy of Sciences, Nanjing, China Peng Xing & Jianjun Wang School of Geography, Nanjing Normal University, Nanjing, China Yongcui Deng Carbon Neutral Innovation Research Center, Xiamen University, Xiamen, China Anyi Hu & Nianzhi Jiao Research Center for Eco-Environmental Sciences, Chinese Academy of Sciences, Beijing, China Yongguan Zhu Authors Yongqin Liu Tao Yu Mukan Ji Tom J.
Battin Marc G. Dumont Yunfeng Yang Pengfei Liu Xuliang Zhuang Peng Xing Jianjun Wang Guannan Mao Yongcui Deng Anyi Hu Yongguan Zhu Nianzhi Jiao Contributions Y.L. designed the study. T.Y. performed the analyses.
Y.L., T.Y. and M.J. led the writing of the paper, with results interpreted by T.J.B., M.G.D., Y.Y., P.L., X.Z., P.X., J.W., G.M., Y.D., A.H., Y.Z. and N.J. All authors contributed to the editing of the text and approved the final version. Corresponding author Correspondence to Yongqin Liu .
Ethics declarations Competing interests Y.L. and T.Y. are inventors on two patent applications (CN202610188022.8 and CN202611034977.4, China, 2026) filed by Lanzhou University related to this work. The other authors declare no competing interests. Peer review Peer review information Nature Microbiology thanks Stefanie Lutz, Mikael Strube and the other, anonymous, reviewer(s) for their contribution to the peer review of this work.
Peer reviewer reports are available. Additional information Publisher’s note Springer Nature remains neutral with regard to jurisdictional claims in published maps and institutional affiliations. Extended data Extended Data Fig.
1 Metagenomic community profiling and genomic characteristics and taxonomic diversity in Tibetan Environmental Genome (TEG) catalogue. a , Read-based quantitative profiling of bacterial, archaeal, fungal, and viral communities across 1,698 environmental metagenomes from the Tibetan Plateau. b , Histograms and density curves showing the genomic quality and characteristics of 17,920 representative species-level genome bins (SGBs). c , UpSet plots showing the overlap of SGBs across ecosystems.
Left horizontal bars indicate total SGB counts, connected dots indicate shared SGBs across combinations, and vertical bars represent intersection sizes. Extended Data Fig. 2 TEG catalogue expands uncultured lineages. a , Stacked area plot showing the aggregated relative abundance of three SGB categories (nomenclature, without nomenclature, and unclassified) across six ecosystems. b , Density distribution illustrating the cross-sample prevalence of the three SGB categories. c , The top 10 uncultured lineages of different taxonomic ranks expanded in the TEG compared to GTDB R220.
The y-axis represents the ratio of the number of SGBs in the TEG to that in GTDB R220. d , e , The two most expanded lineages by the TEG at the family (BP-191) and genus ( JADGNW01 ) levels, respectively. Phylogenetic tree based on 120 conserved bacterial marker genes (left panel) and a clustering matrix based on amino acid identity (AAI) (right panel).
Extended Data Fig. 3 Mean BGC count and mean BGC density among phyla. Average number of BGCs per genome at phylum level (left panel).
Average BGC density per genome at phylum level, calculated as the number of BGCs per Mb of genome (right panel). Extended Data Fig. 4 Scatter plots illustrating genome size in relation to BGC count with phylum-specific correlation patterns.
Locally estimated scatterplot smoothing (LOESS) regression was used for modelling. Solid lines represent LOESS-fitted values, and shaded areas indicate 95% confidence intervals around the fitted values. Two-sided Spearman’s rank correlation tests were used to assess the relationships; exact P values are shown in the panels.
Phyla containing at least 50 genomes were used for assessment. Extended Data Fig. 5 Scatter plots illustrating genome size in relation to BGC density (BGC count per Mb) with phylum-specific correlation patterns.
LOESS regression was used for modeling. Solid lines represent LOESS-fitted values, and shaded areas indicate 95% confidence intervals around the fitted values. Two-sided Spearman’s rank correlation tests were used to assess the relationships; exact P values are shown in the panels.
Phyla containing at least 50 genomes were used for assessment. Extended Data Fig. 7 Boxplot showing differences in normalized amino acid frequency across distinct datasets.
Normalized amino acid frequencies were compared across TEG (n = 19,168), DRAMP (n = 30,260) and MacrelPos (n = 920) antimicrobial peptide datasets and the MacrelNeg (n = 920) non-antimicrobial peptide dataset. Box plots show the median (centre line), the 25th and 75th percentiles (box bounds), and whiskers extending to the minimum and maximum observations within 1.5 × IQR of the lower and upper quartiles, respectively.
Differences among datasets were assessed using the Kruskal–Wallis test followed by post hoc multiple comparisons. Groups sharing a letter are not significantly different at α = 0.05. Extended Data Fig.
9 CRISPR-Cas systems and Cas9 protein diversity. a , Heatmap showing the distribution of CRISPR-Cas system types across different phyla. b , Phylogenetic tree revealing that the TEG has substantially expanded Cas9 protein diversity. Extended Data Fig. 10 Predicted optimal temperatures of 1,077 PET hydrolases and structural comparison with known high-efficiency enzymes. a , Rain cloud plots showing the melting temperature (Tm), optimal temperature (Topt), optimal pH (pHopt), ESMFold-predicted structural metrics (pLDDT and pTM), sequence identity to the reference sequence Ca PETase M9 (ref.
45 ), and crystal structure metrics (RMSD and TM-score) of 1,077 PET hydrolase candidates. Box plots show the median (centre line), the 25th and 75th percentiles (box bounds), and whiskers extending to the minimum and maximum observations within 1.5 × IQR of the lower and upper quartiles, respectively. b , Structural comparison of the crystal structures between four PET candidate proteins and the Ca PETase M9 (7YME) indicating their application potential.
Supplementary information Reporting Summary (download PDF ) Peer Review File (download PDF ) Supplementary Table 1 (download XLSX ) Metadata for 1,698 metagenomic samples. Supplementary Table 2 (download XLSX ) Genomic features and taxonomic annotation of 51,921 strain-level genomes.
Supplementary Table 3 (download XLSX ) Taxonomic comparison of TEG with GTDB R220 at species-level. Supplementary Table 4 (download XLSX ) A summary of 44,719 BGCs identified from 17,920 SGBs. Supplementary Table 5 (download XLSX ) The L2-normalization-based cosine-like distances among the BGCs of TEG, MiGBIG 4.0 28 and BGC Atlas 29 .
Supplementary Table 7 (download XLSX ) MICs of 29 synthesized AMPs against 5 bacterial and 2 fungal strains. Supplementary Table 8 (download XLSX ) Identification of 1,262 CRISPR–Cas systems from TEG. Supplementary Table 9 (download XLSX ) Properties of 216 Cas9 proteins identified from TEG.
Supplementary Table 10 (download XLSX ) A summary of 224,570 candidate plastic-degrading enzymes identified by TEG. Supplementary Data 1 (download XLSX ) Relative read abundance (%) of bacteria, archaea, fungi and viruses across all metagenomic samples classified by Kraken2. Supplementary Data 2 (download ZIP ) Relative read abundance (%) of SGBs across all metagenomic samples.
Supplementary Data 3 (download XLSX ) A summary of 1,077 candidate PET hydrolases identified from TEG. Rights and permissions Open Access This article is licensed under a Creative Commons Attribution-NonCommercial-NoDerivatives 4.0 International License, which permits any non-commercial use, sharing, distribution and reproduction in any medium or format, as long as you give appropriate credit to the original author(s) and the source, provide a link to the Creative Commons licence, and indicate if you modified the licensed material.
You do not have permission under this licence to share adapted material derived from this article or parts of it. The images or other third party material in this article are included in the article’s Creative Commons licence, unless indicated otherwise in a credit line to the material.
If material is not included in the article’s Creative Commons licence and your intended use is not permitted by statutory regulation or exceeds the permitted use, you will need to obtain permission directly from the copyright holder. To view a copy of this licence, visit http://creativecommons.org/licenses/by-nc-nd/4.0/ .
Reprints and permissions About this article Cite this article Liu, Y., Yu, T., Ji, M. et al. Mapping the Tibetan Plateau microbiome across ecosystems provides a resource for biodiscovery. Nat Microbiol (2026). https://doi.org/10.1038/s41564-026-02536-8 Download citation Received : 07 February 2026 Accepted : 08 October 2026 Published : 16 November 2026 Version of record : 16 November 2026 DOI : https://doi.org/10.1038/s41564-026-02536-8
Article text via FreeNewsAPI. Rights remain with Nature.
Read on publisher site → Opens Nature in a new tab