tRNA dosage regulates lineage dependency and resistance in prostate cancer
MainLineage plasticity is a cellular property that enables development and stress adaptation3,4. It is characterized by the ability of cells to differentiate into alternative identities that take on new...
Main Lineage plasticity is a cellular property that enables development and stress adaptation 3 , 4 . It is characterized by the ability of cells to differentiate into alternative identities that take on new epigenetic states, transcriptional programs and morphologies 5 , 6 , 7 . However, in the context of cancer, lineage plasticity is often co-opted as a response to therapies, pulling cancers away from their lineage-specific dependencies to drive drug resistance 8 .
This is especially apparent in lineage-dependent cancers 1 , in which effective inhibition of the driver lineage factor 9 , 10 , 11 , 12 can induce cellular reprogramming to promote cell survival. Like its tissue of origin 13 , prostate cancer requires the androgen receptor (AR) for growth 14 , 15 .
However, genetic loss of TP53 , PTEN or RB or treatment with second-generation AR pathway inhibitors (ARPIs) has been shown to drive lineage independence from the original AR-dependent lineage through neuroendocrine (NE) differentiation or alternative cell states 16 , 17 , 18 , 19 , 20 , 21 .
Despite progress in defining the epigenetic and transcriptional mechanisms that underlie lineage dependencies and transitions in cancer 1 , 2 , the role of mRNA translation in controlling cell fate remains largely unexplored despite its substantial implications for therapy resistance and patient outcomes. tRNAs are the crucial mediators of mRNA decoding that supply amino acids to growing polypeptide chains through the ribosome during protein synthesis 22 . tRNAs are organized into isoacceptor families—molecules that carry the same amino acid but differ in the anticodon—and are further subdivided into isodecoders that share anticodons but differ in their body sequences 23 (Extended Data Fig.
1a ). In mammals, approximately 300 unique isodecoders exist 24 . The advent of methods to quantify tRNA have revealed that tRNA dosage can vary significantly between different cell types and tissues 25 , 26 , 27 , 28 , 29 .
This result suggests that tRNA abundance may be an important catalyst for distinct cellular functions in physiology 30 . Indeed, inherited mutations in various components of RNA polymerase III, the macromolecular complex responsible for tRNA synthesis, lead to tissue-specific diseases rather than a complete loss of cellular functions 31 . tRNA dysregulation has also been implicated in cancer, which highlights its broader impact on human disease 32 .
Altered tRNA pools were first discovered in cancer in 2009 through microarray profiling of breast cancer 33 . Since then, growing evidence has shown that specific tRNAs can actively contribute to distinct cancer-promoting functions. Overexpression of the initiator tRNA iMet has been linked to increased proliferation in breast cancer and metastasis in melanoma 34 , 35 .
Moreover, specific tRNAs can drive metastasis by promoting the translation of mRNAs enriched with their cognate codons 36 . These findings underscore the regulatory role of tRNA dosage in cancer cell behaviour. However, important questions remain, including the mechanisms that underlie tRNA dysregulation in cancer and how tRNA abundance is linked to lineage dependence.
Addressing these questions will provide a unified framework in our fundamental understanding of translation dynamics and their role in shaping the phenotypic diversity of cancer. Using prostate cancer as an archetype of lineage dependence, we report here that a single tRNA species, tRNA 1 Arg (UCU), is a key regulator of lineage conversion and therapy resistance.
We show that tRNA 1 Arg (UCU) changes can promote lineage transitions, and its restoration sensitizes tumours to therapies that target the AR pathway. We identify TARDBP and ZSCAN29 as DNA-binding proteins that regulate the expression of tRNA 1 Arg (UCU) by directly interacting with its genomic locus.
Functionally, tRNA 1 Arg (UCU) governs lineage dependency through translational control of a SWI/SNF chromatin remodelling component, SMARCC2. Clinically, tRNA 1 Arg (UCU) expression is significantly reduced in NE prostate cancer and correlates with reduced overall survival. Together, these findings uncover a previously unrecognized mechanism of tRNA dosage regulation, with implications for lineage dependence and plasticity in lethal prostate cancer. tRNA 1 Arg (UCU) dosage in prostate cancer To map tRNA dynamics during lineage plasticity, we conducted multiplex small RNA sequencing (MSR-seq) 28 to profile full-length tRNAs, their fragments and selected chemical modifications during the transition from prostate adenocarcinoma (AD) to a lineage plastic (LP) state defined by decreased AR activity and increased NE features.
We used an in vitro model, whereby LNCaP AD cells were engineered to undergo lineage plasticity through knockdown of RB1 and overexpression of TP53 R175H , MYCN , ASCL1 , SRRM4 , NR0B2 , BCL2 and KRAS G12V . This combination reproducibly generates a phenotype with reduced AR expression, increased NE markers and resistance to AR-targeted therapies 37 (Extended Data Fig.
1b ). Among 49 isoacceptors, only tRNA Arg (UCU) was significantly downregulated during lineage transition in two separate analyses (DESeq2 analysis, log 2 fold change (log 2 [FC]) = –0.338, false discovery rate (FDR) = 2.42 × 10 –25 in Fig. 1a ; and edgeR analysis, log 2 [FC] = –0.336, FDR = 1.02 × 10 –4 in Extended Data Fig.
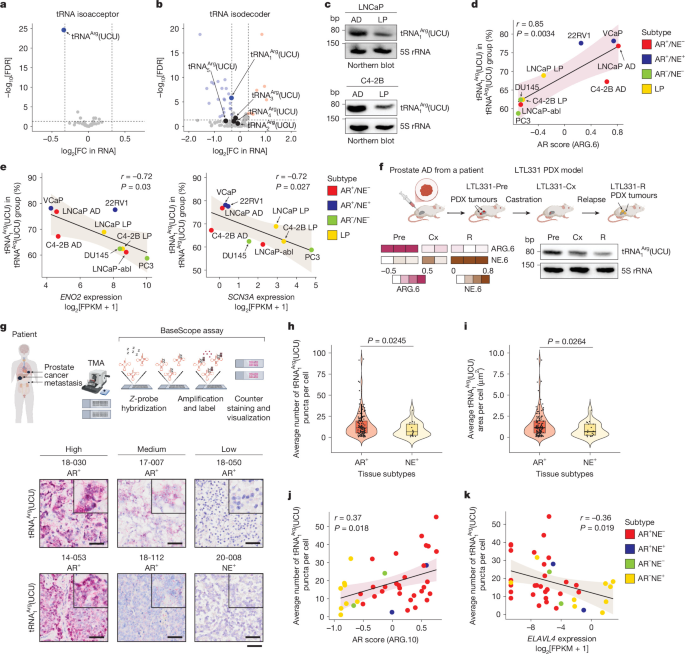
1c and Supplementary Table 1 ). Fig. 1: tRNA 1 Arg (UCU) levels demarcate lineage plasticity in prostate cancer. a , b , Volcano plots showing tRNA isoacceptor ( a ) and isodecoder ( b ) abundance in LNCaP LP and AD cells from DESeq2 analyses using unique molecular identifier (UMI)-derived counts. c , Northern blot of charged tRNA 1 Arg (UCU) and 5S rRNA from LNCaP AD and LP cells (top) and C4-2B AD and LP cells (bottom). d , e , Correlation plots of tRNA 1 Arg (UCU) and the AR score (ARG.6) ( d ) and normalized ENO2 and SCN3A gene expression ( e ) ( n = 9 cell lines).
Pearson’s r and two-sided P values are indicated. f , Schematic of the LTL331 PDX model 39 . Top, prostate AD (Pre) becomes castration resistant following castration (Cx). Relapsed tumours transdifferentiate into NEPC (R).
Bottom left, AR scores (ARG.6) and NE scores (NE.6) among Pre, Cx and R samples. Bottom right, representative northern blot of charged tRNA 1 Arg (UCU) and 5S rRNA. g , Top, workflow of RNA in situ hybridization using BaseScope assays. Using a tRNA 1 Arg (UCU)-specific probe, tRNA expression was detected across prostate cancer tissues from different subtypes and sites of metastasis.
Bottom, representative images of BaseScope assay results, with high, medium and low levels of tRNA 1 Arg (UCU). Scale bar, 50 μm. TMA, tissue microarray. h , i , Violin plots showing distributions of average tRNA puncta per cell ( h ) and distributions of average area of tRNA per cell ( i ) in AR + ( n = 137) and NE + ( n = 18) tumours from TMAs of UW patient tissue samples.
Data are the median ± quartile. The box plots show the median (centre line) and interquartile (IQR) range (box bounds), with whiskers extending to 1.5× the IQR. Two-sided unpaired Welch’s t -test. j , k , Correlation plots between the average number of tRNA 1 Arg (UCU) puncta per cell and the AR score (ARG.10) ( j ) and ELAVL4 gene expression ( k ) in UW-rapid autopsy patient tissue samples.
Spearman’s r and two-sided P values are shown ( n = 41). Schematics in f and g were created in BioRender; Kim, Y. S. https://biorender.com/8mpaz3v (2026).
Source data Among the five tRNA Arg (UCU) isodecoders, tRNA 1 Arg (UCU) was the most abundantly expressed (Extended Data Fig. 1d and Supplementary Table 1 ). Moreover, tRNA 1 Arg (UCU) was the sole tRNA Arg (UCU) isodecoder that was substantially decreased in the context of lineage plasticity (DESeq2 analysis, log 2 [FC] = –0.336, FDR = 1.55 × 10 –6 in Fig.
1b ; and edgeR analysis, log 2 [FC] = –0.357, FDR = 1.626 × 10 –3 in Extended Data Fig. 1e ). Notably, this reduction was not accompanied by changes in fragmentation or chemical modifications (Extended Data Fig.
1f,g ), which indicated that there was a specific reduction in mature tRNA 1 Arg (UCU). Downregulation of tRNA 1 Arg (UCU) was further confirmed by quantitative PCR (qPCR) and northern blot analyses in both LNCaP and C4-2B (a cell line that is a LNCaP metastatic derivative 38 ) AD and LP cells (Fig.
1c and Extended Data Fig. 1h–j ). To investigate the association of tRNA 1 Arg (UCU) and lineage identity, we profiled nine prostate cancer cell lines and observed a strong positive correlation between tRNA 1 Arg (UCU) levels and AR activity (Pearson’s r = 0.85, P = 0.0034; Fig.
1d and Extended Data Fig. 1k ). Conversely, there was a strong negative correlation between two NE marker genes ( ENO2 and SCN3A ) and tRNA 1 Arg (UCU) expression (Pearson’s r = –0.72, P = 0.03 and r = –0.72, P = 0.027, respectively; Fig.
1e and Extended Data Fig. 1l ). We next examined tRNA 1 Arg (UCU) expression in the LTL331 patient-derived xenograft (PDX) model, a well-established PDX derived from prostate AD tissue that transdifferentiates to NE prostate cancer (NEPC) after castration 39 (Fig.
1f ). We found a stepwise reduction in tRNA 1 Arg (UCU) abundance from pre-castration to post-castration to relapse samples (Fig. 1f and Extended Data Fig.
2a ), and this coincided with the loss of AR signalling and acquisition of NE features (Fig. 1f and Extended Data Fig. 2b,c ).
To further validate these findings, we developed an in situ hybridization assay that enabled us to specifically quantify tRNA 1 Arg (UCU) expression in patient tissue samples (Fig. 1g and Extended Data Fig. 2d,e ).
Analyses of 56 patients from the University of Washington (UW) prostate cancer rapid autopsy cohort 18 revealed that AR + tumours express higher levels of tRNA 1 Arg (UCU) than NE + tumours (Fig. 1h,i ), which correlated with the MSR-seq quantification results (Spearman’s correlation coefficient r = 0.41, P = 0.045; Extended Data Fig.
2f ) and not with tRNA chemical modifications at the probe-binding site (Extended Data Fig. 2g ). Furthermore, only tRNA 1 Arg (UCU) was downregulated in both LNCaP LP cells and NE + patient tissue samples (Extended Data Fig.
2h,i and Supplementary Table 2 ). tRNA 1 Arg (UCU) abundance positively correlated with AR activity (Spearman’s r = 0.37, P = 0.018; Fig. 1j ). Conversely, there was a negative correlation between the NE marker gene ELAVL4 (ref.
18 ) and tRNA 1 Arg (UCU) levels (Spearman’s r = –0.36, P = 0.019; Fig. 1k ). These observations across multiple model systems and patient tissue samples collectively establish tRNA 1 Arg (UCU) as a lineage-associated isodecoder, the abundance of which decreases with the transition from AR-driven AD to a LP state in prostate cancer. tRNA 1 Arg (UCU) loss and lineage state It remains unclear whether tRNA 1 Arg (UCU) is simply a marker of lineage transitions or has a functional role in driving them.
To address this gap in knowledge, we engineered doxycycline-inducible short hairpin RNA (shRNA) expression constructs targeting tRNA 1 Arg (UCU) (shUCU) or a non-targeting control (shScr) and stably expressed them in LNCaP and C4-2B cells (Extended Data Fig. 3a ). We observed a 25–50% reduction in tRNA 1 Arg (UCU) levels, as measured by northern blotting (Fig.
2a ) and qPCR (Extended Data Fig. 3b ). Knockdown was specific for tRNA 1 Arg (UCU) and did not affect other tRNA Arg (UCU) isodecoders (Extended Data Fig.
3c ). Silencing of tRNA 1 Arg (UCU) led to a decrease in AR pathway genes at both the transcript (Fig. 2b , Extended Data Fig.
3d–f and Supplementary Table 3 ) and protein levels (Fig. 2c ), alongside increased expression of genes in neuron-related pathways (Fig. 2d,e and Extended Data Fig.
3e–g ). Furthermore, these changes were specific to tRNA 1 Arg (UCU) because knockdown of tRNA 2 Arg (CCG) and tRNA 3 Arg (UCG) did not alter AR pathway gene expression (Extended Data Fig. 3h,i ).
Together, these findings indicate that reducing tRNA 1 Arg (UCU) dosage promotes phenotypic plasticity in androgen-responsive cells. Fig. 2: tRNA 1 Arg (UCU) depletion drives lineage independence and resistance. a , Northern blots of charged tRNA 1 Arg (UCU) and 5S rRNA from cells transduced with shScr or shUCU. b , Volcano plots of RNA-seq from LNCaP (left) and C4-2B (right) cells transduced with shScr or shUCU.
AR pathway genes from ARG.10 and previously published ATAC–seq data 19 are highlighted by yellow circles. c , Immunoblots of AR target proteins. d , GSEA of commonly upregulated gene ontology (GO) terms in LNCaP and C4-2B cells transduced with shUCU. e , qPCR of NE pathway genes in LNCaP cells (left; n = 5 replicates for INSM1 and 6 replicates for SCG3 ) and C4-2B cells (right; n = 3 replicates for INSM1 and SCG3 , right) transduced with shScr or shUCU. f , Confluence of enzalutamide-treated cells.
LNCaP cells (left) were treated with 1 μM ( n = 4 replicates) or 10 μM enzalutamide ( n = 4 replicates), whereas C4-2B cells (right) were treated with 15 μM ( n = 5 replicates) or 30 μM enzalutamide ( n = 5 replicates). g , Top, schematic of the cell viability assay in mouse prostate-derived organoids.
Bottom, cell viability normalized to vehicle-treated controls for each biological replicate ( n = 4 replicates). h , Distribution of weights for ventral prostate lobes from castrated (top) and uncastrated mice (bottom). Data are the mean ± s.e.m. Two-sided Mann–Whitney U -test (top).
Two-sided unpaired Welch’s t -test (bottom). i , Top left, schematic of the Hi-Myc model. Bottom, haematoxylin and eosin (H&E)-stained images of anterior prostates (dotted line indicates high-grade (HG) PIN). Scale bars, 50 μm.
Top right, percentage of Hi-Myc; n-Trtct2 +/+ ( n = 14) and Hi-Myc; n- Trtct2 +/– ( n = 16) mice that developed high-grade PIN after castration. Two-sided Fisher’s exact test. For e – g , data are the mean ± s.e.m., two-sided unpaired Welch’s t -test.
Schematics in g and i were created in BioRender; Kim, Y. S. https://biorender.com/xvfq9ci (2026). Source data Our findings raise the question of whether this phenotypic switch can affect cellular responses to therapeutics that target the AR, which are commonly used in patients with prostate cancer.
To this end, cells transduced with shScr or shUCU were treated with the following ARPIs approved by the US Food and Drug Administration: enzalutamide, apalutamide or darolutamide 40 , 41 , 42 . Notably, shUCU-transduced cells were significantly more resistant to these ARPIs across multiple concentrations in both LNCaP and C4-2B models than shScr-transduced cells (Fig.
2f and Extended Data Fig. 3j ). Conversely, tRNA 1 Arg (UCU) knockdown increased sensitivity to the AURKA inhibitor, alisertib, which has been shown to have activity in NEPC 43 (Extended Data Fig.
3k ). These results demonstrate that decreasing tRNA 1 Arg (UCU) dosage is not only phenotypically relevant but also reprograms AR dependency. To explore the functional impact of tRNA 1 Arg (UCU) depletion in a physiological context, we generated a prostate cancer mouse model haploinsufficient for n- Trtct2 (also known as n-Tr22 ), which encodes tRNA 1 Arg (UCU).
Hi-Myc 44 mice that develop prostate tumours were crossed with n-Trtct2 knockout mice ( n- Trtct2 –/– ) 45 to produce mice with only one copy of the tRNA gene (Hi-Myc; n- Trtct2 +/– ). We derived Hi-Myc; n- Trtct2 +/+ and Hi-Myc; n- Trtct2 +/– organoid lines from these mice (Extended Data Fig.
4a ) and assessed lineage dependence (Fig. 2g ). MYC protein levels were equivalent between the two genotypes, and Hi-Myc; n- Trtct2 +/– organoids had reduced tRNA 1 Arg (UCU) expression (Extended Data Fig.
4b,c ). Reduced n-Trtct2 dosage significantly increased resistance to ARPI treatment by threefold (Fig. 2g ).
To evaluate the in vivo consequences on lineage dependence, Hi-Myc; n- Trtct2 +/+ and Hi-Myc; n- Trtct2 +/– mice were aged for 9 months and subjected to surgical castration to mimic AR pathway inhibition (Extended Data Fig. 4d ). We focused our analyses on ventral and anterior prostate lobes because Hi-Myc mice exhibited strong MYC expression in these lobes (Extended Data Fig.
4e ). No differences were observed in uncastrated controls, whereas castrated Hi-Myc; n- Trtct2 +/– mice displayed significantly enlarged prostate glands (Fig. 2h ).
At a histological level, 25% of castrated Hi-Myc; n- Trtct2 +/– mice exhibited large high-grade prostatic intraepithelial neoplasia (PIN) glands compared with 0% of castrated Hi-Myc; n- Trtct2 +/+ mice (Fig. 2i ). Together, our observations demonstrate that reduced tRNA 1 Arg (UCU) dosage promotes lineage transitions and confer resistance to AR-targeted therapies. tRNA 1 Arg (UCU) drives lineage conversion Next, we asked whether restoration of tRNA 1 Arg (UCU) could reverse lineage transition and restore sensitivity to ARPIs.
Re-expression of tRNA 1 Arg (UCU) in LP cells (UCU cells) was confirmed by northern blotting, and increased tRNA 1 Arg (UCU) abundance did not affect expression levels of the other tRNA Arg (UCU) isodecoders (Fig. 3a and Extended Data Fig. 5a,b ).
We first performed RNA sequencing (RNA-seq) on LNCaP AD, LP and UCU cells to compare expression of AR-regulated genes. AR pathway genes 19 that significantly decreased in the context of lineage plasticity were restored after addback of tRNA 1 Arg (UCU) (Fig. 3b and Supplementary Table 4 ).
This result was supported by qPCR data and further validated at the protein level (Fig. 3c,d ). Conversely, NE marker gene expression decreased after tRNA 1 Arg (UCU) re-expression (Extended Data Fig.
5c ). Lastly, overexpression of genes encoding tRNA Arg (UCU) isodecoders 2–5, tRNA 1 Arg (ACG), tRNA 2 Arg (CCG) and tRNA 4 Arg (CCU) in LNCaP LP cells did not lead to increases in AR pathway genes, which is in contrast to what we observed with tRNA 1 Arg (UCU) addback (Extended Data Fig.
5d–h and Supplementary Table 4 ). Fig. 3: Increased tRNA 1 Arg (UCU) expression induces lineage conversion to AR-dependent phenotypes. a , Northern blot of tRNA 1 Arg (UCU) and 5S rRNA. b , Subset of castration-resistant prostate cancer (CRPC) AR signature genes across LNCaP AD, LP and UCU cells.
Scale bar represents z -score-normalized log 2 -transformed fragments per kilobase per million mapped reads (FPKM) values. c , AR pathway gene expression analysis by qPCR in LNCaP (top; n = 5 replicates) and C4-2B (bottom; n = 6 replicates) AD, LP and UCU cells. Data are the mean ± s.e.m.
One-way analysis of variance (ANOVA) with Šídák’s multiple-comparisons test. d , Immunoblots of AR target genes. e , Baseline-normalized cell survival relative to vehicle-treated controls for each biological replicate. Top, LNCaP AD, LP and UCU cells were treated with 1 or 10 μM enzalutamide (1 μM, n = 5 replicates; 10 μM, n = 5 replicates).
Bottom, C4-2B AD, LP and UCU cells were treated with 15 or 30 μM enzalutamide (15 μM, n = 6 replicates; 30 μM, n = 7 replicates). Data are the mean ± s.e.m. One-way ANOVA with Šídák’s multiple-comparisons test. f , AR pathway expression analysis by qPCR in wild-type (WT) and tRNA 1 Arg (UCU) addback (UCU) LNCaP-abl cells ( n = 5 replicates).
Data are the mean ± s.e.m. Two-sided unpaired Welch’s t -test. g , Immunoblots of PSA (also known as KLK3), NKX3-1 and FKBP5 in LNCaP-abl WT and UCU cells. β-Actin was used as a loading control. h , Baseline-normalized cell survival relative to vehicle-treated controls for each biological replicate ( n = 6 replicates).
Data are the mean ± s.e.m. Two-sided unpaired Welch’s t -test. i , Left, representative H&E-stained images of ventral prostate lobes from TRAMP and TRAMP; n- Trtct2 OE mice (dotted lines demarcate areas of PIN). Scale bar, 25 μm.
Right, quantification of the percentage of PIN-positive glands in the ventral prostates from each genotype. Data are the mean ± s.e.m. Two-sided unpaired Welch’s t -test.
Source data These findings raise the question of whether the restoration of an AR-activated phenotype is functionally relevant. To this end, we treated LNCaP and C4-2B AD, LP and UCU cells with the ARPIs enzalutamide, apalutamide or darolutamide. Relative to AD cells, LP cells were resistant to AR inhibition.
However, addback of tRNA 1 Arg (UCU) was sufficient to restore sensitivity to ARPIs (Fig. 3e and Extended Data Fig. 6a,b ).
By contrast, AD and UCU cells were less sensitive to alisertib treatment than LP cells (Extended Data Fig. 6c ). Next, we sought to determine whether restoration of lineage dependence could be observed in a prostate cancer model in which treatment resistance naturally evolved.
LNCaP-abl is a subline of LNCaP cells that developed androgen insensitivity after 87 passages in androgen-depleted medium 46 . Despite expressing the AR, it has a low AR activity score, reduced tRNA 1 Arg (UCU) expression and is resistant to AR-targeted agents 46 (Fig. 1d and Extended Data Fig.
1k ). We generated LNCaP-abl cells in which tRNA 1 Arg (UCU) was overexpressed. This model had enhanced expression of AR pathway genes at the mRNA and protein levels (Fig.
3f,g and Extended Data Fig. 6d,e ). Moreover, expression of tRNA 1 Arg (UCU) was sufficient to improve the sensitivity of LNCaP-abl cells to enzalutamide (Fig.
3h ). Our findings prompted us to investigate the physiological relevance of increasing tRNA 1 Arg (UCU) dosage on lineage dependence. We used the transgenic AD of the mouse prostate (TRAMP) model, in which mice develop PIN that progresses into poorly differentiated NE tumours 47 , 48 .
These mice were crossed with n- Trtct2 transgenic mice ( n- Trtct2 OE ), which overexpress tRNA 1 Arg (UCU) by eightfold 49 , to generate TRAMP; n- Trtct2 OE mice. After 5 months, corresponding to the emergence of PIN, mice were castrated to deplete androgen levels (Extended Data Fig.
6f ). One month later, prostate tissues were collected and analysed. Notably, TRAMP mice had a higher incidence of PIN glands than TRAMP; n- Trtct2 OE mice.
This result provides support for the concept that increasing tRNA 1 Arg (UCU) dosage promotes AR dependence (Fig. 3i ). Together, these findings reveal that lineage dependency in prostate cancer can be modulated by a single tRNA species.
TARDBP and ZSCAN29 govern tRNA 1 Arg (UCU) We next sought to determine how tRNA 1 Arg (UCU) is downregulated in the context of phenotypic transition. Previous studies have shown that tRNA dosage can be regulated by neighbouring RNA polymerase II activity 50 , 51 and by co-occupancy of RNA polymerase II and transcription factors 51 .
This led us to ask whether there are transcription regulators that specifically occupy the TRR-TCT1-1 (also known as tRNA - Arg-TCT-1-1 ) gene locus. We analysed the ENCODE transcription factor ChIP–seq (chromatin immunopreciptation with high-throughput sequencing) database 52 and identified 11 DNA-binding proteins that interface with the TRR-TCT1-1 gene locus (Fig.
4a ). As transcription factor binding has been shown to buttress tRNA levels 51 , we next asked whether any of these factors are decreased in the context of lineage transition. The COMPASS complex component ASH2L gene 53 , the DNA and RNA binding protein TARDBP gene 54 , the zinc-finger protein ZSCAN29 gene and the telomere-associated protein ZBTB40 gene 55 were all downregulated in LP cells compared with AD cells (Fig.
4b and Supplementary Table 5 ). Fig. 4: TARDBP and ZSCAN29 regulate tRNA 1 Arg (UCU) expression in prostate cancer. a , ASH2L, ATF3, BHLHE40, CEBPB, EP300, JUND, REST, TARDBP, TCF3, ZBTB40 and ZSCAN29 ENCODE ChIP–seq peak distribution at the TRR-TCT1-1 locus.
Scale bar, 2 kb. b , RNA-seq of LNCaP AD and LP cells showing expression changes of transcription factors (highlighted by yellow circles) in a . c , tRNA 1 Arg (UCU) expression measured by qPCR in LNCaP cells (left) and C4-2B cells (right) transfected with non-targeting siRNA (N), siRNA against TARDBP (T; n = 8 replicates) or ZSCAN29 (Z; n = 8 replicates), or siRNAs against both TARDBP and ZSCAN29 (T+Z).
Data are the mean ± s.e.m. Kruskal–Wallis test with Dunn’s multiple-comparisons test. d , Northern blot of tRNA 1 Arg (UCU) and 5S rRNA. e , Correlation plot between TARDBP (top) and ZSCAN29 (bottom) expression and total area of tRNA puncta in UW TMA patient tissue samples analysed using BaseScope assays (Fig.
1g ). Spearman’s correlation is shown. f , CUT&RUN IgG-normalized tracks of TARDBP and ZSCAN29 across all TRR-TCT gene loci. Grey lines denote TRR-TCT genes. g , Rank plot of all tRNA genes and normalized H3K4me3 signals from CUT&RUN in LNCaP AD cells. h , Signal density plot showing H3K4me3 enrichment at tRNA genes across 4,000 bp (2,000 bp upstream and downstream) surrounding the transcription start sites (TSSs) of individual tRNA genes in LNCaP AD cells. i , Signal density plot of H3K4me3 at the TRR-TCT1-1 locus in LNCaP AD and LP cells. j , RNA polymerase III binding analysis at TRR-TCT gene loci by ChIP–qPCR in LNCaP cells (left; n = 5 replicates) and C4-2B cells (right; n = 4 replicates) transfected with non-targeting siRNA or siRNA against TARDBP or ZSCAN29 .
Data are the mean ± s.e.m. Two-way ANOVA with Tukey’s multiple-comparisons test. Source data To determine whether these factors regulate tRNA 1 Arg (UCU) expression, we individually silenced ASH2L , TARDBP , ZSCAN29 and ZBTB40 and quantified tRNA 1 Arg (UCU) abundance.
TARDBP and ZSCAN29 silencing led to a significant decrease, but their combined knockdown did not further reduce tRNA 1 Arg (UCU) levels (Fig. 4c,d and Extended Data Fig. 7a–d ).
ASH2L and ZBTB40 knockdown did not reproducibly affect tRNA 1 Arg (UCU) expression (Extended Data Fig. 7e–h ). Consistent with these findings, nuclear TARDBP and ZSCAN29 protein levels were reduced in LP cells relative to AD cells (Extended Data Fig.
7i ). Moreover, TARDBP and ZSCAN29 expression correlated with tRNA 1 Arg (UCU) abundance in specimens from patients with prostate cancer (Spearman’s r = 0.4, P = 0.0092 for TARDBP ; Spearman’s r = 0.31, P = 0.05 for ZSCAN29 ) (Fig. 4e ).
Given the role of tRNA 1 Arg (UCU) in regulating prostate cancer lineage plasticity, we next investigated whether TARDBP and ZSCAN29 are associated with lineage states in patient tumours. TARDBP and ZSCAN29 expression was inversely correlated with NE and epithelial–mesenchymal transition (EMT) gene signatures (Extended Data Fig.
7j–m ). These findings extend our experimental observation to human disease and establish that TARDBP and ZSCAN29 are associated with lineage plasticity in patients. Next, we performed CUT&RUN profiling of TARDBP and ZSCAN29 across all tRNA genomic loci in LNCaP AD and LP cells.
Among all tRNA genes, TRR-TCT1-1 was the only locus that exhibited coordinated reductions in TARDBP and ZSCAN29 occupancy together with decreased mature tRNA abundance during lineage plasticity (Extended Data Fig. 8a–c ). In the six TRR-TCT isodecoder loci, only TRR-TCT1-1 showed significantly reduced occupancy of both TARDBP (log 2 [FC] = –4.811, FDR = 0.006) and ZSCAN29 (log 2 [FC] = –3.858, FDR = 0.015).
Although TRR-TCT2-1 (also known as tRNA-Arg-TCT-2-1 ) also exhibited reduced TARDBP occupancy (log 2 [FC] = –3.573, FDR = 0.038), ZSCAN29 occupancy was increased in LP cells (log 2 [FC] = 0.532, FDR = 0.015). No significant differences in TARDBP or ZSCAN29 occupancy were detected at TRR-TCT3-1 (also known as tRNA-Arg-TCT-3-1 ), TRR-TCT 3-2 (also known as tRNA-Arg-TCT-3-2 ), TRR-TCT4-1 (also known as tRNA-Arg-TCT-4-1 ) and TRR-TCT 5-1 (also known as tRNA-Arg-TCT-5-1 ) loci (Fig.
4f , Extended Data Fig. 8a and Supplementary Table 6 ). Given that TARDBP occupancy was reduced at both TRR-TCT1-1 and TRR-TCT2-1 loci, whereas ZSCAN29 occupancy was reduced only at TRR-TCT1-1 , we sought to determine why only tRNA 1 Arg (UCU) levels decreased during lineage plasticity (Fig.
1b ). Because H3K4me3 is associated with active RNA polymerase II and III transcriptional activity 51 , 56 , 57 , 58 , we examined H3K4me3 enrichment across TRR-TCT loci. Notably, the TRR-TCT1-1 locus exhibited substantially higher H3K4me3 enrichment than any of the other TRR-TCT loci (Fig.
4g,h ). Moreover, H3K4me3 abundance was decreased selectively at the TRR-TCT1-1 locus following lineage conversion, whereas no significant changes were observed at the TRR-TCT2-1 locus (Fig. 4i and Extended Data Fig.
8d ). Consistent with these chromatin changes, POLR3A CUT&RUN demonstrated a selective reduction in RNA polymerase III occupancy at the TRR-TCT1-1 locus during lineage plasticity, with no corresponding changes at the other TRR-TCT loci (Extended Data Fig. 8e ).
On the basis of these findings, we tested whether TARDBP and ZSCAN29 preferentially regulate expression of the H3K4me3-enriched TRR-TCT1-1 locus compared with all other TRR-TCT loci. Knockdown of TARDBP or ZSCAN29 in LNCaP and C4-2B cells selectively reduced tRNA 1 Arg (UCU) expression, whereas the remaining tRNA Arg (UCU) isodecoders were unaffected (Extended Data Fig.
8f,g ). Consistent with these findings, depletion of TARDBP or ZSCAN29 significantly reduced RNA polymerase III occupancy only at the TRR-TCT1-1 locus in both cell lines (Fig. 4j and Extended Data Fig.
8h,i ). Together, these findings demonstrate that TARDBP and ZSCAN29 preferentially maintain RNA polymerase III occupancy at the H3K4me3-enriched TRR-TCT1-1 locus, which in turn selectively promotes tRNA 1 Arg (UCU) transcription. tRNA 1 Arg (UCU) regulation of translation tRNA levels can regulate mRNA-specific translation through codon optimality 59 .
We reasoned that tRNA 1 Arg (UCU) dosage may influence the translation of AGA-enriched mRNAs to induce lineage dependence. To test this idea, we generated AGA-specific translation reporters in which mCherry is fused to a DHFR degron sequence via a series of in-frame AGA codon linkers 60 (Fig.
5a , top). Efficient translation through the AGA linker leads to translation of the DHFR degron and degradation of mCherry, whereas inefficient translation results in mCherry accumulation. After transduction of AD, LP and UCU cells, LP cells exhibited a fourfold increase in the mCherry-to-EBFP2 signal compared with AD cells, which indicated that there was reduced translational capacity at AGA codons (Fig.
5a , bottom). This effect was highly specific because addback of tRNA 1 Arg (UCU) reduced the fluorescence intensity back to the level of AD cells (Fig. 5a , bottom).
We repeated the assay with different combinations of AGA codon repeats (2×, 4× or 6×) and observed the same trends (Extended Data Fig. 9a ). These findings demonstrate that tRNA 1 Arg (UCU) dosage can influence AGA codon translation in a lineage plasticity model.
Fig. 5: tRNA 1 Arg (UCU) promotes AR activity via SMARCC2. a , Top, schematic of the Arg-AGA codon read-through reporter. Bottom left, representative immunofluorescence images.
Bottom right, dot plots showing mCherry-to-EBFP2 ratios (AD, n = 6 replicates (128 cells); LP, n = 6 replicates (2,000 cells); UCU, n = 7 replicates (762 cells)). Data are the mean ± s.e.m. Kruskal–Wallis test with Dunn’s multiple-comparisons test.
Scale bar, 10 μm. b – d , Codon usage bar plot of LNCaP AD ( b ), LP ( c ) and UCU ( d ) cells. The Arg-AGA codon is highlighted in red. e , Left, scatter plot showing gene expression changes at the transcriptional ( x axis) and translational ( y axis) levels in LNCaP UCU cells relative to LP cells (left).
Right, zoom-in scatter plot displays translationally upregulated subunits of the SWI/SNF complex. P/S, polysome to subpolysome ratio. f , Immunoblot of SMARCC2 in LNCaP AD, LP and UCU cells. g , SMARCC2 expression analysis by qPCR in LNCaP AD, LP and UCU cells ( n = 5 replicates).
Data are the mean ± s.e.m. One-way ANOVA with Šídák’s multiple-comparisons test. h , Immunoblot of WT (AGA) or codon-switched (CGC) Flag-tagged SMARCC2 in LNCaP AD, LP and UCU cells. i , AR pathway expression analysis by qPCR in LNCaP UCU cells after shScramble or shSMARCC2 transduction ( n = 3 replicates).
Data are the mean ± s.e.m. Two-sided unpaired Welch’s t -test. j , Immunoblot of AR target genes. k , Survival of LNCaP UCU cells transduced with shScramble or shSMARCC2 ( n = 7 replicates) treated with 10 or 20 μM enzalutamide. Data are the mean ± s.e.m.
P values calculated using unpaired Welch’s t -test. l – o , Correlation plots between tRNA 1 Arg (UCU) and onset of bone metastasis ( l ), time from start of androgen deprivation therapy (ADT) to death ( m ), time from androgen independence to death ( n ) and overall survival ( o ) in the UW rapid autopsy patient cohort.
Spearman’s r and two-sided P values are indicated ( n = 35). Schematic in a was created in BioRender; Kim, Y. S. https://biorender.com/9h8zrsz (2026).
Source data We next performed polysome RNA-seq to see whether we could observe a similar effect on endogenous mRNAs. Polysome RNA-seq is a technique in which ribosome-bound mRNAs are fractionated by density and sequenced to determine the translation efficiency (TE) of each mRNA transcriptome-wide (Extended Data Fig.
9b ). We compared codon usage among AD, LP and UCU cells by assessing the codon composition of mRNA with the highest and lowest significant TEs (FDR < 0.05). In AD cells, the Arg-AGA codon was one of the most significantly abundant codons in high TE mRNAs along with Lys-AAA and Glu-GAA.
This result indicated that there is efficient translation in the AD model (FDR = 0.0002) (Fig. 5b ). However, in LP cells, Arg-AGA codons were no longer enriched (FDR = 0.62) (Fig.
5c ). Notably, addback of tRNA 1 Arg (UCU) restored AGA codon translation (FDR = 0.0002) (Fig. 5d and Supplementary Table 7 ).
To identify candidate translational targets of tRNA 1 Arg (UCU), we analysed the 2,193 mRNAs that were translationally upregulated following tRNA 1 Arg (UCU) restoration (Fig. 5e , left, and Supplementary Table 8 ). Gene set enrichment analysis (GSEA) revealed enrichment for transcriptional programs, including gene expression (R-HSA-74160, FDR = 0.0023) and RNA polymerase II transcription (R-HSA-73857, FDR = 0.00481) (Extended Data Fig.
9c ). Notably, of these mRNAs, five components of the SWI/SNF chromatin remodelling complex were among the enriched transcripts: ACTB , BCL7B , BCL7C , SMARCB1 and SMARCC2 (Fig. 5e , right).
Given the central role of SWI/SNF in sustaining AR signalling in prostate cancer 61 , we focused subsequent analyses on the core SWI/SNF subunits SMARCB1 and SMARCC2. Of these, only SMARCC2 protein abundance decreased during lineage transition and was restored by tRNA 1 Arg (UCU) addback (Fig.
5f and Extended Data Fig. 9d ), whereas SMARCC2 mRNA levels were unchanged (Fig. 5g ).
To determine whether SMARCC2 sensitivity to tRNA 1 Arg (UCU) abundance is mediated by encoded AGA codons, we generated a codon-switching reporter in which Arg-AGA codons in SMARCC2 were replaced with Arg-CGC codons. Wild-type and codon-switched reporters were introduced into AD, LP and UCU cells.
LP cells transduced with the Arg-AGA reporter showed reduced SMARCC2 protein abundance compared with AD and UCU cells (Fig. 5h ). By contrast, the Arg-CGC reporter was insensitive to lineage state changes (Fig.
5h ). These findings indicate that efficient SMARCC2 translation depends on tRNA 1 Arg (UCU) availability through AGA codon usage. We next examined whether SMARCC2 mediates the lineage effects of tRNA 1 Arg (UCU).
Silencing of SMARCC2 in LNCaP UCU cells reduced AR pathway activity at both the mRNA and protein levels, which led to a reversal of lineage features induced by tRNA 1 Arg (UCU) re-expression (Fig. 5i,j and Extended Data Fig. 9e,f ).
Next, we asked whether this reduction in AR activity alters sensitivity to AR inhibition. Notably, LNCaP UCU cells became resistant to enzalutamide treatment following SMARCC2 knockdown (Fig. 5k ).
Together, these data reveal that tRNA 1 Arg (UCU) regulates the translation of SMARCC2 to modulate lineage state, AR signalling and sensitivity to AR pathway inhibition. tRNA 1 Arg (UCU) and patient outcomes Last, we sought to determine the correlation between tRNA 1 Arg (UCU) expression and patient survival.
Per cell tRNA 1 Arg (UCU) abundance and mean expression were calculated for each tumour sample and correlated with clinical features. Patients with the lowest tRNA 1 Arg (UCU) abundance had a significantly shorter time from diagnosis to first bone metastasis (Spearman’s r = 0.34, P = 0.045), start of androgen deprivation therapy to death (Spearman’s r = 0.36, P = 0.033) and androgen independence to death (Spearman’s r = 0.44, P = 0.011) (Fig.
5l–n ). Together, these equated with a shorter overall survival (Spearman’s r = 0.38, P = 0.023) (Fig. 5o ).
These data reveal that low tRNA 1 Arg (UCU) expression is associated with substantially more aggressive disease and shorter survival. On the basis of these correlations and the observations that tRNA 1 Arg (UCU) depletion increases metastasis-associated genes (Extended Data Fig. 3e,f ), we performed an in vivo metastasis assay using luciferase-expressing C4-2B cells transduced with shScr or shUCU (Extended Data Fig.
9g ). Following intracardiac injection (Extended Data Fig. 9h ), tRNA 1 Arg (UCU) depletion led to a fourfold increase in metastasis (Extended Data Fig.
9i,j ). These findings demonstrate that tRNA 1 Arg (UCU) levels not only affect AR dependence and therapy response in prostate cancer but also metastatic progression in vivo. Discussion Our study highlights the role of tRNA 1 Arg (UCU) as a regulator of lineage dependency in prostate cancer.
Specifically, we uncovered a marked specificity in tRNA dysregulation during lineage transitions. Rather than observing a broad alteration in tRNA abundance, we found that only tRNA 1 Arg (UCU) was consistently decreased when cells underwent a lineage switch from an AR-dependent to an AR-independent state.
This specificity was further validated by tRNA 1 Arg (UCU) knockdown and overexpression experiments, which demonstrated that prostate cancer lineage dependence could be toggled by modulating a single tRNA. Notably, this programmable lineage conversion also had significant therapeutic implications.
Specifically, conversion to an AR-low activity state with NE features conferred resistance to ARPIs. It is intriguing to consider why the reduction of tRNA 1 Arg (UCU) drives ADs to adopt a LP cell fate with NE features. Notably, a comprehensive analysis comparing tRNAs in neurons and non-neuronal cells revealed that tRNA 1 Arg (UCU) exhibited the most significant decrease among all isodecoders 45 , 49 .
This finding indicates that low tRNA 1 Arg (UCU) expression could be a common feature of neuronal gene expression programs. It remains to be determined how tRNA 1 Arg (UCU) controls neuronal expression networks. Another important question raised by our findings is what distinguishes tRNA 1 Arg (UCU) from the other tRNA Arg (UCU) isodecoders.
Although tRNA 4 Arg (UCU) is highly divergent from tRNA 1 Arg (UCU), tRNA 1 Arg (UCU) differs from tRNA 2 Arg (UCU), tRNA 3 Arg (UCU) and tRNA 5 Arg (UCU) by three base pairs (Extended Data Fig. 10a ): one in the acceptor stem (C6-G67 versus U6-A67) and two in the T stem (C49-G65 versus G49-C65 and C50-G64 versus U50-A64 and C50-U64).
These positions contact eukaryotic translation elongation factor 1A (eEF1A), which mediates aminoacyl-tRNA delivery into the ribosome, as well as the ribosome itself in the A, P and E sites (Extended Data Fig. 10b,c ). We speculate that these differences influence interactions with the translation machinery to provide a potential structural basis for tRNA 1 Arg (UCU) specificity.
Our study underscores the importance of isodecoder-specific regulation of tRNAs, extending it beyond canonical RNA polymerase III-mediated transcription. We identified the DNA-binding proteins TARDBP and ZSCAN29 as previously unknown regulators of tRNA 1 Arg (UCU) expression with significant implications for lineage state in prostate cancer.
Although the upstream signals that govern TARDBP and ZSCAN29 expression remain to be defined, integrative analysis identified Notch signalling as a candidate regulatory pathway, consistent with the established loss of Notch activity during NEPC progression 62 , 63 (Extended Data Fig.
10d–f ). These findings complement emerging evidence that transcription factors contribute to the regulation of tRNA abundance. For instance, RNA polymerase-III-bound loci can colocalize with active chromatin regions and engage general transcription factors such as ETS1 and STAT1 to promote tRNA synthesis 51 .
Although this study provides mechanistic insights, we are unable to link these regulatory mechanisms to disease phenotypes. Nevertheless, our study directly implicates tRNA gene regulation in cancer, offering one of the first demonstrations of isodecoder-specific control as a crucial determinant of a malignant state.
Consistent with this view, recent large-scale tRNA expression profiling and network analyses have identified ZZEF1, a sequence-specific transcription factor, as a key regulator of the TRK-TTT3 (also known as tRNA-Lys-TTT-3 ) locus and metastasis in breast cancer 64 . These studies highlight an emerging paradigm in which context-specific transcriptional control of tRNA genes has a fundamental role in cancer biology and underscore the need to fully dissect the regulatory logic underlying RNA polymerase-III-dependent transcription.
Our study also revealed the clinical significance of tRNA 1 Arg (UCU) in prostate cancer. Analyses of patient specimens demonstrated that reduced tRNA 1 Arg (UCU) levels are associated with decreased overall survival in the setting of AR pathway inhibition. However, these clinical associations are derived from retrospective analyses, and prospective studies will be required to assess the predictive utility of tRNA isodecoders as biomarkers of AR-targeted therapy resistance.
Beyond its potential as a biomarker, there is growing interest in the therapeutic application of tRNAs. Notably, adeno-associated virus (AAV)-mediated delivery of suppressor tRNAs has been used to restore protein function in models of mucopolysaccharidosis type I 65 , and lipid nanoparticle-based tRNA delivery has enabled re-expression of CFTR in epithelia derived from patients with cystic fibrosis 66 .
These emerging technologies offer a potential framework for restoring tumour-suppressive tRNA isodecoders such as tRNA 1 Arg (UCU) to reprogram lineage dependency and re-sensitize tumours to therapies in patients with prostate cancer. Methods Patient sample collection Metastatic tumour samples constituting the UW TMAs were collected from patients with metastatic castration-resistant prostate cancer at the UW–Fred Hutchinson Cancer Center (FHCC) after informed consent under Institutional Review Board approval (IRB number 2341).
Samples were collected at the time of rapid autopsy. Ethics statement All animal work was performed in compliance with the protocol (number 50870) approved by the Fred Hutchinson Cancer Center Animal Care and Use Committee. Mice were housed under standard temperature and humidity conditions with a 12-h light–12-h dark cycle in the animal facility at the FHCC.
Mice were closely monitored to minimize discomfort, distress, injury and pain throughout the in vivo experiments. Cell culture LNCaP (LNCaP clone FGC; American Type Culture Collection (ATCC), CRL-1740, RRID: CVCL_1379 ), C4-2B (ATCC, CRL-3315, RRID: CVCL_4784 ), 22RV1 (ATCC, CRL-2505, RRID: CVCL_1045 ), DU145 (ATCC, HTB-81, RRID: CVCL_0105 ) and PC3 (ATCC, CRL−1435, RRID: CVCL_0035 ) cells were cultured in RPMI-1640 medium (Gibco, 11875119) supplemented with 10% FBS, 1% GlutaMax (Gibco, 35050061) and 1% penicillin–streptomycin (Gibco, 15140122) and passaged using 0.05% trypsin-EDTA (Gibco, 25300120).
VCaP (ATCC, CRL-2876, RRID: CVCL_2235 ) and HEK293T (ATCC, CRL-3216, RRID: CVCL_0063 ) cells were cultured in DMEM high-glucose medium (Gibco, 11965118) supplemented with 10% FBS and 1% penicillin–streptomycin and passaged using 0.05% trypsin-EDTA. LNCaP-abl (RRID: CVCL_4793 ) cells were cultured in RPMI-1640 without phenol red (Gibco, 11835055) supplemented with 10% charcoal-stripped FBS (Gibco, 12676029) and 1% penicillin–streptomycin and passaged using TrypLE without phenol red (Gibco, 12604039).
LNCaP AD and LP cells and C4-2B AD and LP cells were cultured in neural stem cell medium consisting of advanced DMEM/F12 (Gibco, 12634028) supplemented with 10 ml B-27 supplement (50×) (Gibco, 17504044), 1% GlutaMax, 10 ng μl −1 bFGF (PeproTech, 100-18B-100UG), 10 ng μl −1 EGF (PeproTech, AF-100-15-100UG) and 1% penicillin–streptomycin.
All cell lines were cultured at 37 °C with 5% CO 2 . LP lines were generated as previously described 37 . Mice Hi-Myc mice (Tg(ARR2/Pbsn-MYC)7Key, RRID: MGI:5486199 ) were bred with n- Trtct2 – /– mice (C57BL6/J|6J.6N-rs46447118, n- Trtct2 (-3_90del)) to generate Hi-Myc; n- Trtct2 +/– mice with one copy of the Trr-Tct1-1 gene.
TRAMP mice (C57BL/6-Tg(TRAMP)8247Ng/J, RRID: IMSR_JAX:003135) were bred with n- Trtct2 OE mice (B6J-Tg(tRNA-Arg-TCT-1-1)529Slac) to generate TRAMP; n- Trtct2 OE mice. NSG male mice (8–12 weeks old) for in vivo metastasis assays were obtained from the Comparative Medicine Translational Research Model Services Core at the FHCC.
For in vivo studies, no formal sample size calculation was performed. Sample sizes were based on prior studies using similar animal models and experimental endpoints. Mouse prostate organoid establishment and culture Prostates from 8–12-week-old Hi-Myc; n- Trtct2 +/+ and Hi-Myc; n- Trtct2 +/– male mice were collected and dissected in DMEM medium supplemented with 10% FBS, 1% GlutaMax and 1% penicillin–streptomycin.
Prostate lobes were microdissected using a clean blade followed by incubation with collagenase I (Gibco, 17018029) for 1 h at 37 °C and trypsin-EDTA 0.05% for 5 min on a 37 °C rocker. Enzyme reaction was quenched by adding dissecting medium containing 1 mg ml −1 DNase (Sigma, 101041590010).
Enzyme-dissociated prostates were mechanically dissociated two or three times using a 3 ml syringe with an 18 G needle and filtered through a 40 μm cell strainer. The dissociated prostates were centrifuged at 350 g for 5 min and resuspended in 1 ml dissecting medium for cell counting and stained with 3 μl each of CD49F-PE (R&D Systems, FAB13501P, RRID: AB_357017) and EpCAM-APC (BioLegend, 118214, RRID: AB_1134102) antibodies.
Isolated prostate cells were enriched for basal stem cell populations (CD49F-positive and EpCAM-positive) by FACS and collected in DMEM medium with 50% FBS, 1% GlutaMax and 1% penicillin–streptomycin. FACS-sorted prostate basal cells were spun down at 350 g for 4 min and resuspended in Matrigel for organoid culture (about 20,000 cells per well) in 24-well ultralow attachment plates (Corning, 3473).
A total of 500 μl organoid medium (Advanced DMEM/F12 supplemented with B-27 supplement, 10 mM HEPES, 1% GlutaMax, 1% penicillin–streptomycin, 500 ng ml −1 R-spondin, 100 ng ml −1 Noggin, 0.1 g N -acetyl- l -cysteine, 200 nM A83-01, 50 ng ml −1 EGF and 10 μM Y-27632) containing 1 nM DHT was added per well and passaged using TrypLE.
Mouse genotyping Mouse tissues were incubated in tail lysis buffer (100 mM Tris pH 8, 400 mM NaCl, 8 M urea, 20 mM EDTA pH 8 and 1% N -lauroylsarcosine sodium salt) with proteinase K (1.67 mg ml −1 ) overnight at 55 °C. DNA was extracted from lysed mouse tissue samples using phenol–chloroform–isoamyl alcohol (Ambion, AM9732) followed by ethanol precipitation.
Genotyping PCR was conducted using GoTaq Green master mix (Promega, PRM7123) using the primers presented in Supplementary Table 9 . The PCR products were analysed by agarose gel electrophoresis. Cloning and plasmid preparation TRR-TCT1-1 , tRNA 2 Arg (CCG) and tRNA 3 Arg (UCG) knockdown by shRNA (Tet-pLKO-puro) The EYFP sequence was cloned into Tet-pLKO-puro (Addgene, 21915) by Gibson assembly (NEB, E2611L). shScramble, shUCU, shCCG and shUCG oligonucleotide sequences (see Supplementary Table 9 for details) were amplified using Q5 high-fidelity 2× master mix (NEB, M0492S) and cloned into Tet-pLKO.1-puro-EYFP using Gibson assembly following enzyme digest with AgeI and EcoRI.
Overexpression of tRNA Arg (UCU) isodecoders and TRR-ACG1-1 , TRR-CCG2-1 and TRR-CCT4-1 (pLKO.1 puro) For overexpression of tRNA Arg (UCU) isodecoders, three tandem repeats of tRNA 1 Arg (UCU), tRNA 2 Arg (UCU), tRNA 3 Arg (UCU), tRNA 4 Arg (UCU) and tRNA 5 Arg (UCU) and their flanking sequences around the genomic loci (±200 bp) (see Supplementary Table 9 for details) were cloned into pLKO.1 puro (Addgene, 8453) following deletion of the U6 promoter region using ClaI and AgeI.
For overexpression of tRNA Arg isodecoders from different isoacceptor groups, plasmids were generated by inserting three tandem repeats of tRNA 1 Arg (ACG), tRNA 2 Arg (CCG) or tRNA 4 Arg (CCU) and flanking sequences around the genomic loci (±200-bp) (see Supplementary Table 9 for details) to pLKO.1 puro without the U6 promoter.
AGA reporter assay (pLJM1-YFP) pLJM1-YFP plasmid (modified from pLJM1-EGFP from D. Sabatini, Addgene, 19319) was digested with AgeI and EcoRI to replace YFP with Flag-mCherry−12×AGA-DHFR by Gibson assembly. Finally, EBFP2-intron-IRES was inserted into the plasmid following enzyme digest with AgeI.
See Supplementary Table 9 for gBlock and primer sequences. Following enzyme digest of the 12× AGA reporter plasmid with EcoRV and PmeI, 2×, 4× and 6× AGA reporters were generated by inserting mCherry and DHFR fragments following PCR with primers listed in Supplementary Table 9 . In the 6× AGA reporter, two 6× AGA codon repeats were separated by CGU-CGA-CGU-CGA codons.
In the 4×AGA reporter, three 4×AGA codon repeats were separated by CGU-CGA codons. In the 2×AGA reporter, six 2×AGA codon repeats were separated by CGA codons (Extended Data Fig. 9a ).
SMARCC2 codon switch plasmid (pLVV-CMV-PGK-BSD) SMARCC2 cDNA sequences with AGA codons either not switched or switched to CGC were linked to 3×Flag and inserted into pLVV-CMV-PGK-BSD following enzyme digest with XhoI and BamHI. shSMARCC2 (pLKO.1-blast) shScramble and shSMARCC2 oligonucleotide sequences (see Supplementary Table 9 for details) were cloned into pLKO.1-blast (Addgene, 26655) by Gibson assembly following enzyme digest with AgeI and EcoRI.
Generation of stable cell lines The C4-2B TRR-TCT1-1 gene knockout cell line was generated by CRISPR ribonucleoprotein nucleofection. In brief, two sgRNAs targeting the gene (TRR-TCT-1-1_gRNA_1: 5′-GACTCCAACAGGTGGCTCCG-3′ and TRR_TCT-1-1_gRNA_2: 5′- AAAAAGCGTTACGACTCCGC-3′) were mixed at a 1:1 ratio to a final concentration of 50 pmol μl −1 .
As negative controls, two AAVS1 sgRNAs (AAVS1_sgRNA_142: 5′-TTCTGGGAGAGGGTAGCGCA-3′ and AAVS1_sgRNA_288: 5′-GAGATGGCTCCAGGAAATGG-3′) were used. The sgRNAs were mixed with complete nucleofector solution, buffer SF (Lonza 4D-Nucleofector X kit, V4XP-3032) and sNLS-SpCas9-sNLS nuclease (Aldevron, 9212-0.25MG) according to the manufacturer’s instructions.
The 20 μl mixture was incubated for 15 min at room temperature and subsequently added to C4-2B cell pellets (3 × 10 5 cells per nucleofection) in 1.5 ml Eppendorf tubes. The solutions were transferred to individual wells of a 16-well Nucleocuvette strip and nucleofection was performed using the DS-137 program.
Nucleofected cells were retrieved with 150 μl cell culture medium by gentle pipetting and plated in a 6-well plate containing 2 ml medium per well. Cells were monitored every day until each well reached about 85–90% confluency. At 72 h after nucleofection, around 50% of the cells in each well were collected for analyses of CRISPR editing efficiency. gDNA was extracted from sgAAVS1 and sgTRR-TCT-1-1 cells using a Quick- DNA Microprep Plus kit (Zymo Research, D4074).
The genomic regions near the sgRNA cut sites were amplified by PCR and the PCR products were purified using a QIAquick PCR Purification kit (Qiagen, 28106) for Sanger sequencing. The sequencing trace files were analysed in the ICE website ( https://ice.synthego.com/#/) to determine CRISPR editing efficiency.
The knockout score was 100 at the TRR-TCT1-1 locus in the knockout cell line. Lentivirus was produced in HEK293T cells grown in 150 mm plates. At 90% confluence, cells were transfected with 0.72 pmol pMD2.G envelop plasmid (Addgene, 12259), 1.3 pmol psPAX2 packaging plasmids (Addgene, 12260) and 1.64 pmol transfer plasmid containing the shRNA targeting tRNA 1 Arg (UCU), tRNA 2 Arg (CCG) or tRNA 3 Arg (UCG), and overexpression plasmids for tRNA Arg (UCU) isodecoders, tRNA 1 Arg (ACG), tRNA 2 Arg (CCG) and tRNA 4 Arg (CCU), AGA codon reporter plasmids, SMARCC2 codon switch plasmids or shRNA targeting SMARCC2 using 1.5–2× μg of 1 mg ml −1 PEI (Polysciences, 23966-100) per μg total plasmid DNA.
After 24 h, the medium was replaced with fresh medium. Virus-containing supernatant was collected 72 h after transfection and filtered through a 0.45 μm filter then aliquoted for storage at −80 °C. LNCaP and C4-2B cells transduced with shScr or shUCU were generated by using 1 ml virus with 8 μg ml −1 polybrene to transduce 1.5 × 10 5 cells in 6-well plates.
Following 72–96 h of transduction, selection was done using 1 and 1.5 μg ml −1 puromycin for LNCaP and C4-2B cells, respectively for 5–7 days. Following puromycin selection, 1 and 1.5 μg ml −1 doxycycline, respectively, was added to the medium every 2–3 days to express shRNA in LNCaP and C4-2B cells. tRNA knockdown was confirmed by northern blotting and qPCR.
C4-2B cells transduced with shCCG or shUCG were generated using the same protocol. For tRNA 1 Arg (UCU) overexpression in LNCaP LP cells and C4-2B LP cells, cells were transduced with 1–2 ml virus and 8 μg ml −1 polybrene and selected using 1 μg ml −1 puromycin for LNCaP LP UCU cells and 1.5 μg ml −1 puromycin for C4-2B LP UCU cells.
LNCaP-abl UCU cells were generated by using 4 ml virus with 8 μg ml −1 polybrene to transduce 1 × 10 6 cells in a 100-mm dish and selected using 1 μg ml −1 puromycin. For overexpression of other tRNA Arg (UCU) isodecoders and tRNA 1 Arg (ACG), tRNA 2 Arg (CCG) and tRNA 4 Arg (CCU) in LNCaP LP cells, cells were transduced using the same protocol described above and selected using 1 μg ml −1 puromycin. tRNA overexpression was validated by northern blotting and/or qPCR.
LNCaP AD, LP, UCU cells transduced with AGA codon reporter plasmids and SMARCC2 codon switch plasmids were generated with 2 ml virus and 8 μg ml − 1 polybrene and selected using 1 μg ml − 1 puromycin. LNCaP UCU cells transduced with shScramble or shSMARCC2 were generated by using 3 ml virus with 8 μg ml −1 polybrene to transduce 80% confluent UCU cells in 6-well plates.
Following 72 h of transduction, selection was conducted using 10 μg ml −1 blasticidin for 5–7 days. mRNA and protein knockdown were validated by qPCR and western blotting. C4-2B cells transduced with shScr or shUCU were generated using lentivirus containing the pFUGW-FerH-ffLuc2-eGFP plasmid (Addgene, 71393) to express luciferase–eGFP.
Following 72–96 h of transduction, selection was done using 1.5 μg ml −1 puromycin for 5–7 days and the transduced cells were grown to around 80% confluence in 100 mm dishes and sorted for eYFP-positive and eGFP-positive cell populations. Sorted C4-2B cells transduced with shScr or shUCU were maintained in medium with 1.5 μg ml −1 doxycycline.
Transient transfection LNCaP and C4-2B cells were seeded at a density of 1 × 10 5 cells per well in 6-well plates 1 day before transfection. Next, 25 pmol ON-TARGETplus SMARTpool siRNAs purchased from Dharmacon (see Supplementary Table 9 for individual sequences) were mixed with 5 μl Lipofectamine RNAiMAX transfection reagent (Invitrogen, 13778075) in 500 μl Opti-MEM reduced serum medium (Gibco, 31985070) and added to each well.
Transfected cells were collected after 7 days for downstream analyses. Western blotting Pelleted cells were lysed in Pierce RIPA buffer (Thermo, 89900) supplemented with protease inhibitor cocktail (Roche, 11836153001) and phosphatase inhibitor (Roche, 4906845001). The lysates were centrifuged at 13,000 g for 10 min at 4 °C and the protein supernatant was transferred and quantified using the Bradford assay (Bio-Rad, 5000006) or a Pierce BCA protein assay kit (Thermo, A55860).
Protein lysates were denatured in 4× Laemmli sample buffer (Bio-Rad, 1610747) with 2-mercaptoethanol at 95 °C for 5 min. Next, 20–50 μg total protein per sample was resolved by SDS–PAGE on 4–20% Mini-PROTEAN gels (Bio-Rad, 4568094) in 1× running buffer (25 mM Tris-base, 192 mM glycine and 0.1% SDS).
Separated proteins were transferred to a PVDF membrane (Bio-Rad, 1704273) in 1× transfer buffer with 20% ethanol using a Trans-Blot Turbo Transfer system (Bio-Rad). Membranes were blocked in 5% non-fat dry milk in 1× TBST for 1 h at room temperature with gentle rocking and washed three times in 1× TBST before overnight incubation with primary antibodies diluted in 5% BSA in 1× TBST with 0.05% sodium azide at 4 °C.
A list of primary antibodies used is provided in Supplementary Table 9 . The membranes were washed three times in 1× TBST and incubated with horseradish peroxidase (HRP)-conjugated secondary antibody (1:5,000–1:10,000 dilution; goat anti-rabbit IgG HRP (Fisher Scientific, PI31460) and goat-anti-mouse IgG HRP (Fisher Scientific, PI31430)) for 1 h at room temperature.
After a final wash with 1× TBST, protein bands were visualized by SuperSignal West Pico PLUS chemiluminescent substrate (Thermo, 34580) and imaged on a ChemiDoc system (Bio-Rad). For stripping, membranes were incubated with stripping buffer (100 mM Tris-HCl, 2% (w/v) SDS and 100 mM 2-mercaptoethanol) on a rocker at room temperature for 15 min.
The membranes were washed three times in 1× TBST followed by another round of blocking and incubation with primary antibodies. RNA isolation and purification Cells were lysed in TRIzol (Fisher Scientific, 15596018) and the lysates were vortexed and incubated at room temperature for 5 min.
Next, one-fifth volume of chloroform was added and mixed thoroughly by vortexing followed by centrifugation at 12,000 g for 15 min at 4 °C. The aqueous layer was transferred and incubated with isopropanol at −20 °C for 0.5 to 1 h. After centrifugation at maximum speed for 15 min at 4 °C, RNA pellets were washed twice with 75% ice-cold ethanol following resuspension in RNase-free water.
For northern blotting, RNA pellets were resuspended in 10 mM sodium acetate pH 4.8 and 1 mM EDTA. The RNA concentration was measured using a Nanodrop instrument. For MSR-seq, RNA was extracted from cells and tumours using a miRNeasy Mini kit (Qiagen, 217004) or a mirVana miRNA Isolation kit (Thermo Fisher, AM1560) per the manufacturer’s protocol.
Northern blotting RNA samples were denatured in 2× loading dye (8 M urea, 100 mM sodium acetate pH 4.8, 0.05% (w/v) bromophenol blue, 0.05% (w/v) xylene cyanol and 1× TAE) at 70 °C for 10 min and immediately placed on ice. For each sample, 1–3 μg total RNA was separated on acid urea polyacrylamide gels (6% polyacrylamide, 7.5 M urea, 1× TAE and 100 mM sodium acetate pH 4.8) using a Mini-PROTEAN Tetra system (Bio-Rad).
RNA was transferred to a positively charged nylon membrane (Cytiva, RPN1210B) in 0.5× TBE buffer for 20–25 min using a Trans-Blot Turbo Transfer system (Bio-Rad) and crosslinked using the optimal crosslink mode (120mJ cm –2 ) in a Spectrolinker UV Crosslinker & Sanitizing Cabinet.
The membranes were prehybridized in ULTRAhyb-Oligo buffer (Invitrogen, AM8663) at 42 °C for 1 h followed by overnight hybridization with 5 pmol 5′-end biotin-labelled probes in hybridization buffer (see Supplementary Table 9 for probe sequences) at 42 °C. The membranes were washed twice in 2× SSC and 0.5% SDS buffer, and further incubated with streptavidin–HRP conjugate (1:5,000 dilution; Genscript, M00091) in hybridization buffer (20 mM sodium phosphate pH 7, 300 mM NaCl and 1% SDS) for 1 h at room temperature.
The membranes were washed two or three times in 20 mM sodium phosphate pH 7, 300 mM NaCl, 2 mM EDTA and 0.1% SDS. RNA bands were visualized using Clarity western ECL substrate (Bio-Rad, 1705061) and imaged on a ChemiDoc system (Bio-Rad). For stripping, membranes were incubated with a stripping buffer (0.1× SSC with 0.1% SDS) at 42 °C for 1 h and incubated with 5 pmol 5′-end biotin-labelled probes in hybridization buffer.
RT–qPCR cDNA was reversed transcribed from 0.5–1 μg RNA using iScript Reverse Transcription supermix (Bio-Rad, 1708841) and subsequently used for iTaq Universal SYBR Green supermix qPCR (Bio-Rad, 1725122). qPCR was performed using a CFX384 Real-Time system (Bio-Rad). RNA expression levels were analysed using the \({2}^{-\Delta \Delta {C}_{{\rm{t}}}}\) method normalizing to housekeeping genes ( TBP or PPIA ).
All primer sequences are provided in Supplementary Table 9 . All RT–qPCR experiments were performed in at least three biological replicates and mean ± s.e.m. values are reported. MSR-seq library preparation tRNA libraries were prepared using the Multiplex Small RNA Sequencing (MSR-Seq) workflow 28 .
Up to 100 ng total RNA per sample was diluted to 7 μl, followed by oxidation with 1 μl 100 mM sodium periodate and 1 μl 90 mM acetate buffer (pH 4.8). After 30 min at 25 °C, the reaction was quenched with 1 μl 0.6 M ribose. β-Elimination was performed by adding 5 μl sodium tetraborate (pH 8.4) and incubating at 45 °C for 45 min.
Next, 5 μl T4 PNK master mix was added to repair the 3′ end, and samples were incubated at 37 °C for 20 min and heat-inactivated. Barcoded 3′ adaptors were ligated in a 50 μl reaction containing 15% PEG8000, 500 μM ATP, 5% DMSO, 1 mM HCC and T4 RNA ligase I, and incubated overnight at 16 °C.
Reactions were quenched with 50 μl EDTA stop solution and pooled. Streptavidin-coated beads were added and washed, followed by dephosphorylation using Quick CIP at 37 °C for 30 min. Beads were resuspended and subjected to reverse transcription with SuperScript IV VILO master mix, incubated at 55 °C for 10 min, then 35 °C overnight.
After RNase H treatment, a second oxidation and ligation step was performed on-bead using the same reagents and conditions as described above. PCR amplification used Q5 polymerase in a 50 μl reaction with indexed primers. Cycle number 9–15 was determined empirically.
Amplified products were cleaned with a DNA Clean & Concentrator-5 (Zymo Research, D4003), and size-selected on a 10% native TBE-PAGE gel (Bio-Rad, 3450053). DNA fragments (around 175–300 bp) were excised, eluted overnight, ethanol-precipitated with GlycoBlue (Thermo Fisher, AM9515) and resuspended in RNase-free water.
Library quality was confirmed using an Agilent TapeStation and sequenced on an Illumina NovaSeq at the University of Chicago. MSR-seq analysis Barcode demultiplexing and sequence alignment were performed as previously described 28 . In brief, the libraries were aligned to a custom curated GRCh38/hg38 human transcriptome of nonredundant, high-confidence mature tRNA sequences from the Genomic tRNA Database (GtRNAdb) 67 , 68 plus 22 mitochondrially encoded tRNA sequences (Supplementary Table 10 ) using bowtie2 (v.2.5.4) and converted to.bam files by SAMtools.
Filtered.bam files were processed and merged to sum all the reads of each tRNA gene. Analysis of tRNA expression, fragmentation and modifications were performed with previously developed custom scripts 69 ( https://github.com/Luke-F1875/MSRseq_data_processing_pipeline ). edgeR (v.4.2.0) was run on full-length tRNA transcripts to calculate counts for each isodecoder tRNA.
Isoacceptor tRNA counts were made by aggregating anticodon counts for the same isoacceptor group, and edgeR was additionally run on this count dataset. tRNA fragment and modification analysis were performed as previously described 28 , 69 , which is part of the routine MSR-seq analysis pipeline.
DESeq2 (v.1.48.1) and edgeR packages were used for statistical analysis. Bulk RNA-seq library preparation and sequencing RNA-seq library preparation and sequencing were performed by the Genomics Core at the Fred Hutchinson Cancer Center. In brief, RNA-seq libraries were prepared from total RNA using a Watchmaker mRNA Library Prep kit (Watchmaker Genomics, 7BK0001) per the manufacturer’s instructions.
Library quantification was performed using a Qubit Flex fluorometer (Invitrogen) and size distribution was validated using an Agilent 4200 TapeStation (Agilent Technologies). The sequencing libraries were pooled in equimolar ratios for paired-end 100 bp sequencing on an Illumina NovaSeq X Plus.
RNA-seq analysis of prostate cancer cell lines Sequencing reads were mapped to the GRCh38/hg38 human genome using STAR (v.2.7.3a). Gene-level abundance was quantified using the GenomicAlignments summarizeOverlaps function using mode=IntersectionStrict, restricting to primary aligned reads, and counting reads mapping to the exonic regions of genes.
FPKM values were calculated using R and used for all downstream analyses. GSEA analysis Differential gene expression analysis of RNA-seq data was conducted by using Bioconductor package enrichR (v.3.2) in R using the GO Molecular Function 2023, GO Cellular Component 2023, GO Biological Process 2023, KEGG 2021 and Reactome 2022 pathway databases.
GSVA The GSVA (v.1.52.3) package in R was used to calculate gene expression signature scores for AR and NE pathways 18 , 20 , 70 . The ARG.6 gene set was defined as AR , KLK3 , KLK2 , TMPRSS2 , PMEPA1 and NKX3-1 . The ARG.10 gene set included KLK3 , KLK2 , TMPRSS2 , PMEPA1 , NKX3-1 , PLPP1 , ALDH1A3 , FKBP5 , STEAP4 and PART1 .
The NE.6 score was calculated using CHGA , SYP , INSM1 , ASCL1 , SCG3 and SEZ6 as inputs. The NE.10 gene set was defined as CHGA , SYP , INSM1 , CHGB , CHRNB2 , ELAVL4 , ENO2 , PCSK1 , SCN3A and NKX2-1 . For the ASCL1 pathway score, genes in the NOURUZI NEPC ASCL1 TARGETS set were used 71 .
The EMT pathway genes for GSVA were obtained from GAVISH 3CA MALIGNANT METAPROGRAM 12 EMT 2 (ref. 72 ). The SOX2 pathway score was analysed by using the top 150 or 300 genes significantly enriched for SOX2 binding in the prostate cancer ChIP–seq dataset ( GSM5065468 ) 73 .
Metastasis pathway genes were obtained from Chandran Metastasis Up, Chandran Metastasis Top50 Up, Chandran Metastasis Dn, Chandran Metastasis Top50 Dn, Tomlins Metastasis Up and Tomlins Metastasis Down from the GSEA Molecular Signatures Database 74 , 75 . All the genes in the individual pathways are listed in Supplementary Table 11 .
Drug treatment assay In 96-well plates, 2,500 cells were plated per well and treated with DMSO (vehicle control) or enzalutamide for 72 h. LNCaP AD, LP and UCU cells were treated with 1 or 10 μM enzalutamide, whereas C4-2B AD, LP and UCU cells were treated with 15 or 30 μM enzalutamide.
LNCaP-abl WT and UCU cells were treated with 75 μM enzalutamide. LNCaP AD, LP and UCU cells and C4-2B AD, LP and UCU cells were treated with DMSO or the following drugs for 120 h: apalutamide, 5 and 10 μM for LNCaP cells or 30 μM for C4-2B cells; darolutamide, 5 and 10 μM for LNCaP cells or 10 μM for C4-2B cells; or alisertib, 2 μM for LNCaP cells or 10 and 20 μM for C4-2B cells.
LNCaP UCU cells transduced with shScr or shSMARCC2 were treated with 10 and 20 μM enzalutamide for 120 h followed by cell viability measurements. Overall, 3–4 technical replicates were included per condition per cell line, and all the treatment assays were completed in at least three biological replicates.
LNCaP and C4-2B cells transduced with Scr or shUCU were plated at a density of 2,500 cells per well, treated with either DMSO or drugs (enzalutamide, LNCaP (1 and 10 μM) and C4-2B (15 and 30 μM); apalutamide, LNCaP (10 μM) and C4-2B (30 μM); darolutamide, LNCaP (5 μM) and C4-2B (30 μM); alisertib, C4-2B (10 and 20 μM)) and incubated at 37 °C in an atmosphere of 5% CO 2 .
Cell growth was measured for 7 days using an Incucyte live-cell imaging and analysis system (Sartorius). The baseline-normalized fold change in cell confluence between day 0 and day 7 was averaged among technical replicates per condition per cell line in each biological replicate.
Mouse prostate organoids were plated in Matrigel (50,000 cells per well) and incubated in organoid medium with DHT containing DMSO or 10 μM enzalutamide for 72 h at 37 °C. Cells were extracted from Matrigel at the time of collection, and cell viability was quantified using a CellTiterGlo luminescent cell viability assay (Promega, G9241) from the four biological replicates.
CellTiterGlo luminescent cell viability assay Following drug treatment, cell viability was measured using CellTiter-Glo assays according to the manufacturer’s instructions (Promega, G9681 for LNCaP AD, LP and UCU cells, C4-2B AD, LP and UCU cells, LNCaP UCU cells transduced with shScr or shSMARCC2, and mouse prostate organoids; G9241 for LNCaP-abl WT and UCU cells).
In brief, 100 μl CellTiter-Glo reagent (Promega) was added to each well and mixed gently for complete cell lysis. Medium-only wells were included for background signal subtraction. Following 30 min of incubation at room temperature, luminescence was measured using a Synergy H1 plate reader (Biotek).
Luminescence measurement from technical replicates was averaged and normalized in each biological replicate, and cell viability was calculated by dividing the average luminescence in enzalutamide-treated wells by the average luminescence in DMSO-only wells. Per cent cell survival in each cell or organoid line is reported as the mean ± s.e.m.
Mouse castration surgery and prostate collection Castration surgery was performed at 9 months of age for the Hi-Myc model and 5 months of age for the TRAMP model. In brief, a small incision was made in the lower abdomen, each testis was exteriorized with forceps and cut through the fat pad and testicular artery with a cautery pen.
The fascia and external skin layer were closed with sutures. Mice were monitored for 72 h after surgery for signs of pain or bleeding. Following castration, mice were aged around 9–10 weeks for the Hi-Myc model and 4 weeks for the TRAMP model.
Prostates were collected in 1× DPBS and immediately fixed in 10% neutral-buffered formalin at 4 °C for 48–72 h. Fixed mouse prostates were dehydrated in ethanol, further processed and embedded in paraffin by the Experimental Histopathology Core at the Fred Hutchinson Cancer Center.
H&E staining Embedded mouse prostates were sectioned at 5 μm on a standard rotary microtome (Leica). H&E staining was conducted by hydration of prostate slices with xylene and a series of ethanol and then stained with haematoxylin (Fisher Scientific, SH26-4D) and eosin (Sigma, E4382).
The H&E-stained slides were scanned by the Experimental Histopathology Core at the FHCC and image analysis was done using semi-automated image analysis software HALO (Indica Labs, v.3.6). Mouse prostate PIN analysis PIN regions in mouse prostate samples were histologically examined on the basis of key features, including epithelial stratification and crowding, cribriform architecture and protrusion of luminal layers to the lumen.
Continue reading
Watch a short ad to unlock the full article
The rest stays locked if you skip or close the ad early.
Compared with normal mouse prostate, low-grade PIN is characterized by epithelial tufting and partial lumen crowding 76 , 77 . High-grade PIN is a strongly premalignant lesion characterized by dense epithelial piling, nearly filled lumens, complex papillary growth and the presence of cribriform histology.
Histopathological evaluation was performed in a blind manner by three independent reviewers for the detection of high-grade PIN in mouse anterior prostates. Immunohistochemistry Deparaffinized mouse prostate tissue sections were stained with MYC antibody (1:100 dilution; Abcam, ab32072) using a standard protocol.
In brief, the sections were baked at 60 °C for 1 h and rehydrated with CitriSolv and a series of ethanol washes. Antigen unmasking was done at 125 °C for 7 min followed by blocking for 1 h at room temperature in blocking solution (1× TBS + 5% (v/v) goat serum (Fisher, ICN19135680), 1% (w/v) BSA (Sigma, A7906) and 0.1% Triton X-100 (Fisher, BP151)).
The slides were washed with 1× TBS and incubated with the primary antibody overnight at 4 °C. The next day, slides were washed three times in 1× TBS and incubated with EnVision+ Single reagent (HRP rabbit) (Dako, K4003) at room temperature for 1 h. Chromogenic detection was done by applying Dako liquid DAB+ substrate (Dako, K3467) for 3 min followed by counterstaining with haematoxylin (Dako, S3309) for 1 min.
The slides were immediately washed with ammonium hydroxide and water, applied with mounting medium (Dako, S3025) and coverslipped for imaging. The slides were scanned using a Ventana DP200 imager and analysed with HALO (Indica Labs, v.3.6) semi-automated image analysis software. In situ RNA hybridization assay and image analysis Formalin-fixed paraffin-embedded tissues were baked for 1 h at 60 °C.
The slides were loaded onto a Bond Rx Autostainer platform (Leica) to initiate the run. The slides were baked and dewaxed using Leica Bond reagents for dewaxing (Dewax Solution). Antigen retrieval was performed at 95 °C for 15 min using Leica Epitope Retrieval Solution 2 followed byBaseScope protease enzyme for 15 min at 40 °C.
After the pretreatment steps, the slides were exposed to hydrogen peroxide for 10 min and then incubated with the custom designed probe against tRNA 1 Arg (UCU), BA-Hs-tRNA-Arg.TCT-1-1-1zz-st-C1 (ACD, 1811158-C1), the positive-control probe BA-Hs-Ppib-1zz (ACD, 710178) or the negative control-probe BA-DapB-zz (ACD, 701028) at 42 °C for 120 min.
After probe incubation, staining continued using a BaseScope LS Reagent kit (ACD, 323600) for the amplification and detection steps, followed by use of a Bond Polymer Refine Red detection kit (Leica, DS9390). Slides were removed from the Bond Autostainer and rinsed in water and allowed to air dry before being dipped in xylene and coverslipped.
The slides were cured at room temperature and ×40 images of the slides were acquired on a VS200 imaging system at the Experimental Histopathology Core. Images were analysed using the semi-automated image analysis software HALO (Indica Labs, v.3.6). In the HALO analysis, classifiers were created to distinguish and quantify probe signals from the tumour tissues.
The number and area of puncta from probes in tumours were measured and used for statistical analyses. ENCODE transcription factor ChIP data analysis Analysis of transcription factor binding near the TRR-TCT1-1 gene locus was conducted by surveying the ENCODE transcription factor ChIP data from GM12878, HepG2 and K562 cell lines.
Signals with peak calling were identified using the GRCh38/hg38 UCSC genome browser. Visualization of the ChIP–seq tracks were captured from the website. Immunofluorescence LNCaP AD and LP cells were fixed in 10% neutral-buffered formalin for 15 min at room temperature and washed with PBS.
Next, 100 μl histogel (LabStorage, HG-4000) heated to 65 °C was used to resuspend the cell pellets. The cell pellets were embedded in three drops of histogel and processed at the Experimental Histopathology Core. In brief, following rehydration, antigen unmasking and blocking, primary antibodies (TARDBP, 1:50 dilution; ZSCAN29, 1:20 dilution) (see Supplementary Table 9 for details) were added to the slides and incubated overnight at 4 °C in a humidity chamber.
The next day, the slides were incubated with secondary antibodies (anti-mouse Alexa Fluor 594 (Invitrogen, A11032), 1:500 dilution; anti-rabbit Alexa Fuor 488 (Invitrogen, A11034), 1:500 dilution) (see Supplementary Table 9 for details) for 1 h at room temperature. After 3 washes with 1× TBS, DAPI mounting medium (Vector laboratories, H-2000) was added onto each sample and glass cover slipped for imaging by confocal microscopy.
CUT&RUN LNCaP AD and LP cell lines were collected and resuspended in 1× PBS with 100 μg ml −1 DNase I for 15 min at 37 °C. The cell pellets were resuspended in 90 μl wash buffer (20 mM HEPES-NaOH pH 7.5, 150 mM NaCl and 0.5 mM spermidine with EDTA-free protease inhibitor cocktail) and bound to 10 μl concanavalin A-conjugated beads (EpiCypher, 21-1401) prewashed in binding buffer (20 mM HEPES-KOH pH 7.9, 10 mM KCl, 1 mM CaCl 2 and 1 mM MnCl 2 ).
Following 10 min of incubation at room temperature, the tubes were placed on a magnetic stand and the supernatants were removed. The ConA-bead-permeabilized cell mixture was resuspended in 100 μl antibody solution (wash buffer with 2 mM EDTA). Antibodies (anti-rabbit IgG, H3K4me3, POLR3A, TARDBP and ZSCAN29; see Supplementary Table 9 for details) were added and mixed gently.
The samples were incubated with antibodies overnight at 4 °C with mixing and submitted to the Genomics Core High Throughput Screening Laboratory at the Fred Hutchinson Cancer Center for autoCUT&RUN processing. At the Core, libraries were prepared using a Beckman Biomek i7 liquid-handling instrument equipped with a 96S Super Magnet Plate (Alpaqua, SKU A001322) for MNase chromatin digestion and magnetic separation of samples during wash steps.
End-repair, adapter ligation and PCR amplification reactions were performed on a separate thermocycler, and purified PCR products were analysed on an Agilent 4200 TapeStation (Agilent Technologies). The libraries were pooled for paired-end 50 bp sequencing on an Illumina NovaSeq X Plus.
CUT&RUN sequencing and data analysis Sequencing reads were aligned to the human reference genome (hg38) using bowtie2, and only uniquely mapped reads were retained for downstream analyses. Peak calling was performed using SEACR (Sparse Enrichment Analysis for CUT&RUN; v.1.3) with matched IgG controls using the relaxed threshold setting.
CUT&RUN reads were quantified over annotated tRNA loci extended by 50 bp upstream and downstream using summarizeOverlaps from the Bioconductor GenomicAlignments package (v.1.40.0). Only primary, properly paired alignments with a mapping quality (MAPQ) ≥ 30 were included in the analysis.
Raw fragment counts were imported into the edgeR package (v.4.2.0), in which library sizes were normalized using the trimmed mean of M -values method. Differential occupancy between conditions was assessed using the quasi-likelihood negative binomial generalized linear model framework implemented in edgeR, and P values were adjusted for multiple testing using the Benjamini–Hochberg FDR procedure.
ChIP–qPCR ChIP–qPCR was performed according to the manufacturer’s instructions (Thermo, 26157). LNCaP and C4-2B cells transfected with non-targeting, TARDBP or ZSCAN29 siRNAs were crosslinked with 1% paraformaldehyde for 10 min at room temperature then neutralized with 1× glycine solution for 5 min.
After removal of formaldehyde–glycine-containing solution, cells were collected in 1× PBS containing protease inhibitor cocktail and spun down at 3,000 g for 5 min at 4 °C. The cell pellets were resuspended in 200 μl membrane extraction buffer and incubated on ice for 10 min. Following centrifugation at 9,000 g for 3 min, the pellets of nuclei were resuspended in MNase digestion buffer with MNase.
The nuclei–MNase mixture was incubated at 37 °C for 15 min. The MNase reaction was stopped by incubating with MNase stop solution on ice for 5 min. The nuclei were pelleted by centrifugation at 9,000 g for 5 min at 4 °C and resuspended in 100 μl 1× IP dilution buffer.
Sonication was conducted using Q800R3 sonicator (Qsonica) for 10 min at 4 °C with the following setting: 20% amplitude, 20 s on and 10 s off. Supernatants after centrifugation at 9,000 g for 5 min were transferred to 1.5 ml Eppendorf tubes containing primary antibodies (anti-rabbit IgG, POLR3A, TARDBP and ZSCAN29; see Supplementary Table 9 for details).
The immunoprecipitation reactions were incubated overnight at 4 °C with mixing. The next day, the immunoprecipitation reactions were incubated with protein A/G magnetic beads for 2 h at 4 °C on a rotator. The tubes with immunoprecipitation reactions were placed on a magnetic stand and the supernatants were carefully removed by pipetting.
Washing with IP wash buffer 1 was conducted three times and IP wash buffer 2 with 350 mM NaCl twice. 1× elution buffer was added after the last wash and the tubes were incubated at 65 °C for 30 min followed by proteinase K digestion. DNA was recovered using a MinElute Reaction Cleanup kit (Qiagen, 28006) and used for qPCR with the primers listed in Supplementary Table 9 .
The qPCR results from each immunoprecipitation sample were normalized to input (Δ C t ) and further normalized to IgG control (ΔΔ C t ). The fold enrichment of POLR3A , TARDBP and ZSCAN29 at different TRR-TCT isodecoder gene loci was normalized to TRR-TCT1-1 in each biological replicate for statistical analysis.
Confocal imaging and analysis Imaging was conducted in the FHCC Cellular Imaging Core using a Dragonfly 200 (Andor Technologies) spinning disk confocal microscope on a Leica DMi8 microscope stand equipped with a ×63/1.4 PL APO CS2 objective. DAPI, Alexa488 and Alexa594 were excited with 405 nm, 488 nm and 561 nm lasers, respectively, and detected on a Zyla 4.2 sCMOS camera with detection windows 445/46, 525/30 and 594/43, respectively.
Z stacks were acquired for each condition. Each image was analysed using Imaris (Oxford Instruments, v.10.2). Immunofluorescence image analysis The immunofluorescence-stained slides were visualized using the DAPI signal to identify cell nuclei and GFP and RFP signals to quantify nuclear ZSCAN29 and TARDBP expression, respectively.
Foci per cell were segmented using Imaris Cell, and we report the mean foci intensity per cell nuclei. The differences in mean intensity of GFP and RFP signals between LNCaP AD and LP cell lines were used for statistical analysis. Codon reporter assay analysis For the analysis of confocal images from LNCaP AD, LP and UCU cells expressing the 12×, 6×, 4× and 2× reporter constructs, the EBFP2 signal was used to identify cells, and the mCherry signal to identify foci.
Foci per cell were segmented using Imaris Cell, reporting maximum foci intensity of mCherry per cell and further normalized by the mean intensity of EBFP2. The ratios of mCherry-to-EBFP2 intensity among LNCaP AD, LP and UCU cell lines were used for statistical analysis. Polysome profiling Polysome profiling was conducted as previously described 78 , 79 .
Before lysis, LNCaP AD, LP and UCU cells were collected and centrifuged at 500 g for 5 min. The cell pellets were resuspended in 1 ml PBS with 100 μg ml −1 cycloheximide in ethanol and placed on ice for 10 min. Cell pellets were collected following centrifugation, flash-frozen in liquid nitrogen and lysed in polysome lysis buffer (10 mM Tris pH 8, 140 mM NaCl, 1.5 mM MgCl 2 , 0.25% NP-40, 0.1% Triton X-100, 640 units of SUPERase-In RNase inhibitor (Thermo, AM2694), 150 μg ml −1 cycloheximide and 20 mM DTT).
Lysed cells were incubated on ice for 45 min with vortexing every 10 min and centrifuged at 9,300 g for 5 min at 4 °C. Cleared lysates were measured by a Bradford assay and 1.5 mg of protein was loaded onto each polysome gradient generated by mixing 10–50% sucrose gradients using a Biocomp gradient station.
The gradients were centrifuged at 37,000 rpm using a SW41 rotor for 2.5 h at 4 °C and fractionated on a Biocomp fractionator into 14 fractions. On the basis of A 280 UV peaks measured using an EM-1 UV monitor (Bio-Rad), fractions were pooled into highly translated (five or more ribosomes), lowly translated (two to four ribosomes) and monosome (one ribosome) groups following RNA extraction.
Polysome RNA-seq library construction RNA was extracted from LNCaP AD, LP and UCU polysome fractions using a Direct-zol RNA Miniprep kit (Zymo Research, R2053). RNA samples combined into 80S monosome, low polysome, high polysome samples and total RNA were used for RNA-seq library construction with a TruSeq Stranded mRNA library prep kit (Illumina, 20020595).
In brief, 300 ng RNA was combined with ERCC Spike in controls (1:1,000 dilution; Invitrogen, 4456740) and proceeded with polyA+ RNA isolation, cDNA synthesis, end repair, A-base addition and ligation of the Illumina indexed adapters according to the manufacturer’s instructions. Libraries were selected for 250–300 bp fragments using AMPure XP beads (Beckman Coulter, A63881) and PCR amplified.
After PCR cleanup with AMPure XP beads, the libraries were quantified using a Qubit dsDNA HS assay (Thermo Fisher, Q32851), and the fragment size was analysed using an Agilent TapeStation. The libraries were pooled for paired-end 100 bp sequencing on an Illumina NovaSeq 6000. Polysome RNA-seq analysis Raw sequencing reads were assessed for quality using FastQC (v.0.12.1).
Libraries that passed quality control were trimmed of sequencing adaptors then aligned to the GRCh38 human genome using STAR2 (v.2.7.3a) and quantified for gene-level expression using HTSeq (v.0.11.1) against the GENCODE v.39 gene annotation database to calculate strand-specific read counts for each gene.
Differential gene expression analysis was performed using DESeq2 (v.1.48.1) to find genes that were transcriptionally regulated using a log 2 [FC] of 25% and an adjusted P value of 0.05. Xtail (v.1.2.0) was used to analyse genome-wide TE by calculating the ratio of polysome-to-monosome for each transcript.
Cut-off values were made using a log 2 [FC] of 15% and an adjusted FDR of 0.05 to find transcripts with significant changes at the translational level. Codon usage analysis For each cell type (AD, LP and UCU), genes with the highest and lowest TE were selected from Xtail analysis (v.1.2.0).
Codon frequencies for each gene were calculated from MANE Select transcripts (v.1.4) using GENCODE v.46 protein-coding transcript sequences as the fraction of each sense codon relative to total sense codons in the coding sequence. To control for amino acid composition differences between gene sets, codon frequencies were normalized in each amino acid family by dividing each codon’s frequency by the sum of frequencies of all synonymous codons for the same amino acid, which generated relative codon usage frequencies.
Methionine (AUG) and tryptophan (UGG), each encoded by a single codon, were excluded as uninformative. For each of the 59 remaining sense codons in each cell type, we computed the observed difference in mean relative codon frequency between the high-TE and low-TE gene sets. To generate a null distribution, we pooled the genes and randomly permuted the high and low TE labels 10,000 times, recomputing the mean relative frequency difference for each permutation.
Two-sided empirical P values were calculated as ( m + 1)/( N + 1), where m is the number of permutations with an absolute difference greater than or equal to the observed absolute difference and N is the total number of permutations. P values were corrected for multiple testing using the Benjamini–Hochberg method across 59 codons in each cell type.
In vivo metastasis assay In brief, 2 × 10 5 C4-2B cells transduced with shScr or shUCU and eGFP-luciferase expression were resuspended in 100 μl PBS and xenografted into 8–12-week-old male NSG mice via intracardiac injection ( n = 10 mice per group) using the ultrasound in the FHCC preclinical Imaging Core.
Following injection, mice were given water containing doxycycline (1 g l –1 ) for stable expression of shRNAs during the assay. Metastasis of injected cells was monitored in vivo by bioluminescence imaging. In brief, mice were given 150 mg kg −1 VivoGlo Luciferin (Promega, P1042) by intraperitoneal injection and anaesthetized in an isofluorane induction chamber for 5–10 min.
The mice were placed in Lago X under continued isoflurane anaesthesia, and bioluminescence signals from metastatic cells were captured using Easy Mode. The monitoring was conducted at least once a week until day 64. The bioluminescence signals from each measurement were quantified using AuraAnalysis software (v.5.0.0) and analysed between groups (shScr and shUCU) and within groups.
Visualization All plots were made using GraphPad Prism (v.10.6.1) or R (v.4.6.0) with base R or ggplot2 and the final figures were assembled using Adobe Illustrator. Statistical analysis Statistical tests were performed using GraphPad Prism 10 (v.10.6.1) or R (v.4.6.0). No randomization or blinding was conducted in this study.
All analyses were based on objective quantification of the data generated from in vitro and in vivo experiments. Specific statistical analyses and the number of replicates for each experiment are described in detail in the figure legends and relevant sections in the Methods . All data are presented as the mean ± s.e.m. unless specified otherwise.
All statistical analyses were two-sided and unpaired unless specified otherwise. For comparison of three or more groups, ANOVA with multiple-comparisons tests was used. Statistical tests used are listed in the figure legends.
P values are shown in the respective figures. P values from Extended Data Figs. 1f,g and 2g are included in Supplementary Table 12 .
Reporting summary Further information on research design is available in the Nature Portfolio Reporting Summary linked to this article. Data availability MSR-seq, RNA-seq, CUT&RUN and Polysome RNA-seq data can be accessed in the Gene Expression Omnibus (GEO) under accession GSE304469 .
Source data are provided with this paper. Code availability All bioinformatics analyses were carried out using publicly available software and packages as described in the Methods . Custom code written for this study are accessible at GitHub ( https://github.com/sonali-bioc/Kim_Arg_TCT_1_1_Manuscript ).
References Garraway, L. A. & Sellers, W. R.
Lineage dependency and lineage-survival oncogenes in human cancer. Nat. Rev.
Cancer 6 , 593–602 https://doi.org/10.1038/nrc1947 (2006). Article CAS PubMed Google Scholar Quintanal-Villalonga, A. et al. Lineage plasticity in cancer: a shared pathway of therapeutic resistance.
Nat. Rev. Clin.
Oncol. 17 , 360–371 https://doi.org/10.1038/s41571-020-0340-z (2020). Article PubMed PubMed Central Google Scholar Linneberg-Agerholm, M. et al.
The primitive endoderm supports lineage plasticity to enable regulative development. Cell 187 , 4010–4029 https://doi.org/10.1016/j.cell.2024.05.051 (2024). Article CAS PubMed PubMed Central Google Scholar Tierney, M.
T. et al. Vitamin A resolves lineage plasticity to orchestrate stem cell lineage choices. Science 383 eadi7342 https://doi.org/10.1126/science.adi7342 (2024).
Article CAS PubMed PubMed Central Google Scholar Davis, R. L., Weintraub, H. & Lassar, A. B.
Expression of a single transfected cDNA converts fibroblasts to myoblasts. Cell 51 , 987–1000 https://doi.org/10.1016/0092-8674(87)90585-x (1987). Article CAS PubMed Google Scholar Graf, T. & Enver, T.
Forcing cells to change lineages. Nature 462 , 587–594 https://doi.org/10.1038/nature08533 (2009). Article ADS CAS PubMed Google Scholar Ge, Y. et al.
Stem cell lineage infidelity drives wound repair and cancer. Cell 169 , 636–650 https://doi.org/10.1016/j.cell.2017.03.042 (2017). Article CAS PubMed PubMed Central Google Scholar Beltran, H. et al.
The role of lineage plasticity in prostate cancer therapy resistance. Clin. Cancer Res.
25 , 6916–6924 https://doi.org/10.1158/1078-0432.CCR-19-1423 (2019). Article CAS PubMed PubMed Central Google Scholar Scher, H. I. et al.
Increased survival with enzalutamide in prostate cancer after chemotherapy. N. Engl.
J. Med. 367 , 1187–1197 https://doi.org/10.1056/NEJMoa1207506 (2012).
Article CAS PubMed Google Scholar de Bono, J. S. et al. Abiraterone and increased survival in metastatic prostate cancer.
N. Engl. J.
Med. 364 , 1995–2005 https://doi.org/10.1056/NEJMoa1014618 (2011). Article PubMed PubMed Central Google Scholar Cole, M.
P., Jones, C. T. & Todd, I. D.
A new anti-oestrogenic agent in late breast cancer. An early clinical appraisal of ICI46474. Br.
J. Cancer 25 , 270–275 https://doi.org/10.1038/bjc.1971.33 (1971). Article CAS PubMed PubMed Central Google Scholar Huggins, C., Stevens, R.
E. & Hodges, C. V. Studies on prostate cancer.
II. The effects of castration on advanced carcinoma of the prostate gland. Arch.
Surg. 43 , 209–223 (1941). Article CAS Google Scholar Cunha, G.
R. et al. Development of the human prostate. Differentiation 103 , 24–45 https://doi.org/10.1016/j.diff.2018.08.005 (2018).
Article CAS PubMed PubMed Central Google Scholar Feldman, B. J. & Feldman, D. The development of androgen-independent prostate cancer.
Nat. Rev. Cancer 1 , 34–45 https://doi.org/10.1038/35094009 (2001).
Article CAS PubMed Google Scholar Chen, C. et al. Molecular determinants of resistance to antiandrogen therapy. Nat.
Med. 10 , 33–39 https://doi.org/10.1038/nm972 (2004). Article CAS PubMed Google Scholar Mu, P. et al.
SOX2 promotes lineage plasticity and antiandrogen resistance in TP53- and RB1-deficient prostate cancer. Science 355 , 84–88 https://doi.org/10.1126/science.aah4307 (2017). Article ADS CAS PubMed PubMed Central Google Scholar Ku, S.
Y. et al. Rb1 and Trp53 cooperate to suppress prostate cancer lineage plasticity, metastasis, and antiandrogen resistance. Science 355 , 78–83 https://doi.org/10.1126/science.aah4199 (2017).
Article ADS CAS PubMed PubMed Central Google Scholar Bluemn, E. G. et al. Androgen receptor pathway-independent prostate cancer is sustained through FGF signaling.
Cancer Cell 32 , 474–489 https://doi.org/10.1016/j.ccell.2017.09.003 (2017). Article CAS PubMed PubMed Central Google Scholar Tang, F. et al. Chromatin profiles classify castration-resistant prostate cancers suggesting therapeutic targets.
Science 376 , eabe1505 https://doi.org/10.1126/science.abe1505 (2022). Article CAS PubMed PubMed Central Google Scholar Beltran, H. et al. Divergent clonal evolution of castration-resistant neuroendocrine prostate cancer.
Nat. Med. 22 , 298–305 https://doi.org/10.1038/nm.4045 (2016).
Article CAS PubMed PubMed Central Google Scholar Zhao, S. G. et al. Associations of luminal and basal subtyping of prostate cancer with prognosis and response to androgen deprivation therapy.
JAMA Oncol. 3 , 1663–1672 https://doi.org/10.1001/jamaoncol.2017.0751 (2017). Article PubMed PubMed Central Google Scholar Schimmel, P.
The emerging complexity of the tRNA world: mammalian tRNAs beyond protein synthesis. Nat. Rev.
Mol. Cell Biol. 19 , 45–58 https://doi.org/10.1038/nrm.2017.77 (2018).
Article CAS PubMed Google Scholar Pan, T. Modifications and functional genomics of human transfer RNA. Cell Res.
28 , 395–404 https://doi.org/10.1038/s41422-018-0013-y (2018). Article CAS PubMed PubMed Central Google Scholar Umu, S. U. et al.
A comprehensive profile of circulating RNAs in human serum. RNA Biol. 15 , 242–250 https://doi.org/10.1080/15476286.2017.1403003 (2018).
Article PubMed Google Scholar Dittmar, K. A., Goodenbour, J. M. & Pan, T.
Tissue-specific differences in human transfer RNA expression. PLoS Genet. 2 , e221 https://doi.org/10.1371/journal.pgen.0020221 (2006).
Article CAS PubMed PubMed Central Google Scholar Gao, L. et al. Selective gene expression maintains human tRNA anticodon pools during differentiation. Nat.
Cell Biol. 26 , 100–112 https://doi.org/10.1038/s41556-023-01317-3 (2024). Article CAS PubMed PubMed Central Google Scholar Pinkard, O., McFarland, S., Sweet, T. & Coller, J.
Quantitative tRNA-sequencing uncovers metazoan tissue-specific tRNA regulation. Nat. Commun.
11 , 4104 https://doi.org/10.1038/s41467-020-17879-x (2020). Article ADS CAS PubMed PubMed Central Google Scholar Watkins, C. P., Zhang, W., Wylder, A.
C., Katanski, C. D. & Pan, T. A multiplex platform for small RNA sequencing elucidates multifaceted tRNA stress response and translational regulation.
Nat. Commun. 13 , 2491 https://doi.org/10.1038/s41467-022-30261-3 (2022).
Article ADS CAS PubMed PubMed Central Google Scholar Gingold, H. et al. A dual program for translation regulation in cellular proliferation and differentiation. Cell 158 , 1281–1292 https://doi.org/10.1016/j.cell.2014.08.011 (2014).
Article CAS PubMed Google Scholar Hughes, L. A. et al. Copy number variation in tRNA isodecoder genes impairs mammalian development and balanced translation.
Nat. Commun. 14 , 2210 https://doi.org/10.1038/s41467-023-37843-9 (2023).
Article ADS CAS PubMed PubMed Central Google Scholar Lata, E. et al. RNA polymerase III subunit mutations in genetic diseases. Front.
Mol. Biosci. 8 , 696438 https://doi.org/10.3389/fmolb.2021.696438 (2021).
Article CAS PubMed PubMed Central Google Scholar Pinzaru, A. M. & Tavazoie, S. F.
Transfer RNAs as dynamic and critical regulators of cancer progression. Nat. Rev.
Cancer 23 , 746–761 https://doi.org/10.1038/s41568-023-00611-4 (2023). Article CAS PubMed Google Scholar Pavon-Eternod, M. et al. tRNA over-expression in breast cancer and functional consequences. Nucleic Acids Res.
37 , 7268–7280 https://doi.org/10.1093/nar/gkp787 (2009). Article CAS PubMed PubMed Central Google Scholar Birch, J. et al. The initiator methionine tRNA drives cell migration and invasion leading to increased metastatic potential in melanoma.
Biol. Open 5 , 1371–1379 https://doi.org/10.1242/bio.019075 (2016). Article CAS PubMed PubMed Central Google Scholar Pavon-Eternod, M., Gomes, S., Rosner, M.
R. & Pan, T. Overexpression of initiator methionine tRNA leads to global reprogramming of tRNA expression and increased proliferation in human epithelial cells. RNA 19 , 461–466 https://doi.org/10.1261/rna.037507.112 (2013).
Article CAS PubMed PubMed Central Google Scholar Goodarzi, H. et al. Modulated expression of specific tRNAs drives gene expression and cancer progression. Cell 165 , 1416–1427 https://doi.org/10.1016/j.cell.2016.05.046 (2016).
Article CAS PubMed PubMed Central Google Scholar Li, S. et al. Defined cellular reprogramming of androgen receptor-active prostate cancer to neuroendocrine prostate cancer. Reviewed preprint at eLife https://doi.org/10.7554/eLife.106511.1 (2025).
Liu, A. Y. et al. Lineage relationship between LNCaP and LNCaP-derived prostate cancer cell lines.
Prostate 60 , 98–108 https://doi.org/10.1002/pros.20031 (2004). Article CAS PubMed Google Scholar Lin, D. et al. High fidelity patient-derived xenografts for accelerating prostate cancer discovery and drug development.
Cancer Res. 74 , 1272–1283 https://doi.org/10.1158/0008-5472.CAN-13-2921-T (2014). Article CAS PubMed Google Scholar Davis, I.
D. et al. Enzalutamide with standard first-line therapy in metastatic prostate cancer. N.
Engl. J. Med.
381 , 121–131 https://doi.org/10.1056/NEJMoa1903835 (2019). Article CAS PubMed Google Scholar Chi, K. N. et al.
Apalutamide for metastatic, castration-sensitive prostate cancer. N. Engl.
J. Med. 381 , 13–24 https://doi.org/10.1056/NEJMoa1903307 (2019).
Article CAS PubMed Google Scholar Smith, M. R. et al. Darolutamide and survival in metastatic, hormone-sensitive prostate cancer.
N. Engl. J.
Med. 386 , 1132–1142 https://doi.org/10.1056/NEJMoa2119115 (2022). Article CAS PubMed PubMed Central Google Scholar Beltran, H. et al.
A Phase II trial of the aurora kinase a inhibitor alisertib for patients with castration-resistant and neuroendocrine prostate cancer: efficacy and biomarkers. Clin. Cancer Res.
25 , 43–51 https://doi.org/10.1158/1078-0432.CCR-18-1912 (2019). Article CAS PubMed Google Scholar Ellwood-Yen, K. et al. Myc-driven murine prostate cancer shares molecular features with human prostate tumors.
Cancer Cell 4 , 223–238 https://doi.org/10.1016/s1535-6108(03)00197-1 (2003). Article CAS PubMed Google Scholar Kapur, M., Molumby, M. J., Guzman, C., Heinz, S. & Ackerman, S.
L. Cell-type-specific expression of tRNAs in the brain regulates cellular homeostasis. Neuron 112 , 1397–1415 https://doi.org/10.1016/j.neuron.2024.01.028 (2024).
Article CAS PubMed PubMed Central Google Scholar Culig, Z. et al. Switch from antagonist to agonist of the androgen receptor bicalutamide is associated with prostate tumour progression in a new model system. Br.
J. Cancer 81 , 242–251 https://doi.org/10.1038/sj.bjc.6690684 (1999). Article CAS PubMed PubMed Central Google Scholar Hurwitz, A.
A., Foster, B. A., Allison, J. P., Greenberg, N.
M. & Kwon, E. D. The TRAMP mouse as a model for prostate cancer.
Curr. Protoc. Immunol.
45 , 20.25.21–20.25.23 https://doi.org/10.1002/0471142735.im2005s45 (2001). Article Google Scholar Parisotto, M. & Metzger, D. Genetically engineered mouse models of prostate cancer.
Mol. Oncol. 7 , 190–205 https://doi.org/10.1016/j.molonc.2013.02.005 (2013).
Article CAS PubMed PubMed Central Google Scholar Kapur, M. et al. Expression of the neuronal tRNA n-Tr20 regulates synaptic transmission and seizure susceptibility. Neuron 108 , 193–208 https://doi.org/10.1016/j.neuron.2020.07.023 (2020).
Article CAS PubMed PubMed Central Google Scholar Gerber, A., Ito, K., Chu, C. S. & Roeder, R. G.
Gene-specific control of tRNA expression by RNA polymerase II. Mol. Cell 78 , 765–778 https://doi.org/10.1016/j.molcel.2020.03.023 (2020).
Article CAS PubMed PubMed Central Google Scholar Oler, A. J. et al. Human RNA polymerase III transcriptomes and relationships to Pol II promoter chromatin and enhancer-binding factors.
Nat. Struct. Mol.
Biol. 17 , 620–628 https://doi.org/10.1038/nsmb.1801 (2010). Article CAS PubMed PubMed Central Google Scholar ENCODE Project Consortium et al.
Expanded encyclopaedias of DNA elements in the human and mouse genomes. Nature 583 , 699–710 https://doi.org/10.1038/s41586-020-2493-4 (2020). Article ADS CAS Google Scholar Bochynska, A., Luscher-Firzlaff, J. & Luscher, B.
Modes of interaction of KMT2 histone h3 lysine 4 methyltransferase/COMPASS complexes with chromatin. Cells 7 , 17 https://doi.org/10.3390/cells7030017 (2018). Article CAS PubMed PubMed Central Google Scholar Morera, A.
A., Ahmed, N. S. & Schwartz, J. C.
TDP-43 regulates transcription at protein-coding genes and Alu retrotransposons. Biochim. Biophys.
Acta, Gene Regul. Mech. 1862 , 194434 https://doi.org/10.1016/j.bbagrm.2019.194434 (2019).
Article CAS PubMed PubMed Central Google Scholar Zhou, M. et al. ZBTB40 is a telomere-associated protein and protects telomeres in human ALT cells. J.
Biol. Chem. 299 , 105053 https://doi.org/10.1016/j.jbc.2023.105053 (2023).
Article CAS PubMed PubMed Central Google Scholar Barski, A. et al. Pol II and its associated epigenetic marks are present at Pol III-transcribed noncoding RNA genes. Nat.
Struct. Mol. Biol.
17 , 629–634 https://doi.org/10.1038/nsmb.1806 (2010). Article CAS PubMed PubMed Central Google Scholar Lauberth, S. M. et al.
H3K4me3 interactions with TAF3 regulate preinitiation complex assembly and selective gene activation. Cell 152 , 1021–1036 https://doi.org/10.1016/j.cell.2013.01.052 (2013). Article ADS CAS PubMed PubMed Central Google Scholar Moqtaderi, Z. et al.
Genomic binding profiles of functionally distinct RNA polymerase III transcription complexes in human cells. Nat. Struct.
Mol. Biol. 17 , 635–640 https://doi.org/10.1038/nsmb.1794 (2010).
Article CAS PubMed PubMed Central Google Scholar Hanson, G. & Coller, J. Codon optimality, bias and usage in translation and mRNA decay. Nat.
Rev. Mol. Cell Biol.
19 , 20–30 https://doi.org/10.1038/nrm.2017.91 (2018). Article CAS PubMed Google Scholar Darnell, A. M., Subramaniam, A.
R. & O’Shea, E. K. Translational control through differential ribosome pausing during amino acid limitation in mammalian cells.
Mol Cell 71 , 229–243 https://doi.org/10.1016/j.molcel.2018.06.041 (2018). Article CAS PubMed PubMed Central Google Scholar Xiao, L. et al. Targeting SWI/SNF ATPases in enhancer-addicted prostate cancer.
Nature 601 , 434–439 https://doi.org/10.1038/s41586-021-04246-z (2022). Article ADS CAS PubMed Google Scholar Ku, S. Y. et al.
Notch signaling suppresses neuroendocrine differentiation and alters the immune microenvironment in advanced prostate cancer. J. Clin.
Invest. 134 , e175217 https://doi.org/10.1172/JCI175217 (2024). Article CAS PubMed PubMed Central Google Scholar Puca, L. et al.
Delta-like protein 3 expression and therapeutic targeting in neuroendocrine prostate cancer. Sci. Transl.
Med. 11 , eaav0891 https://doi.org/10.1126/scitranslmed.aav0891 (2019). Article CAS PubMed PubMed Central Google Scholar Chen, S. et al.
Discovery of a tRNA-regulatory transcription factor that suppresses breast cancer metastasis. Preprint at bioRxiv https://doi.org/10.1101/2025.04.26.650725 (2025). Wang, J. et al.
AAV-delivered suppressor tRNA overcomes a nonsense mutation in mice. Nature 604 , 343–348 https://doi.org/10.1038/s41586-022-04533-3 (2022). Article ADS CAS PubMed PubMed Central Google Scholar Albers, S. et al.
Engineered tRNAs suppress nonsense mutations in cells and in vivo. Nature 618 , 842–848 https://doi.org/10.1038/s41586-023-06133-1 (2023). Article ADS CAS PubMed PubMed Central Google Scholar Chan, P.
P. & Lowe, T. M. GtRNAdb: a database of transfer RNA genes detected in genomic sequence.
Nucleic Acids Res. 37 , D93–D97 https://doi.org/10.1093/nar/gkn787 (2009). Article CAS PubMed Google Scholar Chan, P.
P. & Lowe, T. M. GtRNAdb 2.0: an expanded database of transfer RNA genes identified in complete and draft genomes.
Nucleic Acids Res. 44 , D184–D189 https://doi.org/10.1093/nar/gkv1309 (2016). Article CAS PubMed Google Scholar Frietze, L.
R. & Pan, T. Bioinformatics of simultaneous, quantitative measurements of full-length tRNA and tRNA fragments by MSR sequencing. Methods Enzymol.
711 , 312–323 https://doi.org/10.1016/bs.mie.2024.11.009 (2025). Article CAS PubMed Google Scholar Hieronymus, H. et al. Gene expression signature-based chemical genomic prediction identifies a novel class of HSP90 pathway modulators.
Cancer Cell 10 , 321–330 https://doi.org/10.1016/j.ccr.2006.09.005 (2006). Article CAS PubMed Google Scholar Nouruzi, S. et al. ASCL1 activates neuronal stem cell-like lineage programming through remodeling of the chromatin landscape in prostate cancer.
Nat. Commun. 13 , 2282 https://doi.org/10.1038/s41467-022-29963-5 (2022).
Article ADS CAS PubMed PubMed Central Google Scholar Gavish, A. et al. Hallmarks of transcriptional intratumour heterogeneity across a thousand tumours. Nature 618 , 598–606 https://doi.org/10.1038/s41586-023-06130-4 (2023).
Article ADS CAS PubMed Google Scholar de Wet, L. et al. SOX2 mediates metabolic reprogramming of prostate cancer cells. Oncogene 41 , 1190–1202 https://doi.org/10.1038/s41388-021-02157-x (2022).
Article CAS PubMed PubMed Central Google Scholar Chandran, U. R. et al. Gene expression profiles of prostate cancer reveal involvement of multiple molecular pathways in the metastatic process.
BMC Cancer 7 , 64 https://doi.org/10.1186/1471-2407-7-64 (2007). Article CAS PubMed PubMed Central Google Scholar Tomlins, S. A. et al.
Integrative molecular concept modeling of prostate cancer progression. Nat. Genet.
39 , 41–51 https://doi.org/10.1038/ng1935 (2007). Article CAS PubMed Google Scholar Suttie, A. et al. A grading scheme for the assessment of proliferative lesions of the mouse prostate in the TRAMP model.
Toxicol. Pathol. 31 , 31–38 https://doi.org/10.1080/01926230390173842 (2003).
Article PubMed Google Scholar Park, J. H. et al. Prostatic intraepithelial neoplasia in genetically engineered mice.
Am. J. Pathol.
161 , 727–735 https://doi.org/10.1016/S0002-9440(10)64228-9 (2002). Article PubMed PubMed Central Google Scholar Schuster, S. L. et al.
Multi-level functional genomics reveals molecular and cellular oncogenicity of patient-based 3′ untranslated region mutations. Cell Rep. 42 , 112840 https://doi.org/10.1016/j.celrep.2023.112840 (2023).
Article CAS PubMed PubMed Central Google Scholar Jana, S. et al. Transcriptional-translational conflict is a barrier to cellular transformation and cancer progression. Cancer Cell 41 , 853–870 https://doi.org/10.1016/j.ccell.2023.03.021 (2023).
Article CAS PubMed PubMed Central Google Scholar Download references Acknowledgements We thank the patients who contributed to this study and members of the Hsieh Laboratory for their insights; and E. Yu, H. Cheng, B.
Montgomery, J. Hawley, M. Schweizer, C.
Higano, D. Lin, F. Vakar-Lopez, M.
Roudier, L. True and M. Chambers and the rapid autopsy teams for their contributions to the University of Washington Medical Center Prostate Cancer Donor Rapid Autopsy Program.
Funding This work was supported by NIH grants R37 CA230617, R01 CA276308, R01 CA317052 and R01 CA311423, a DoD PCRP Idea Award (W81XWH-22-1-0370), a Prostate Cancer Foundation Challenge Award, Seattle Translational Tumor Research, the American Cancer Society (Discovery Boost Grant DBG-25-1373505-01-RMC), the Larry & Virginia Gordon Endowed Chair in Prostate and Bladder Cancer Research, and the Nancy & Dick Bernheimer, Matthews Family, Stinchcomb Family, and Thomas & Patricia Wright Memorial Funds to A.C.H.
Y.S.K. is funded by DoD PCRP Early Investigator Research Award HT9425-23-1-0123 and NIH NCI K99 CA300907. This research was also supported by the Genomics & Bioinformatics, Cellular Imaging, Flow Cytometry, Experimental Histopathology, Preclinical Imaging, and Comparative Medicine Shared Resources of the Fred Hutchinson Cancer Center (FHCC) (P30 CA015704).
J.A.W. is supported by TL1 DK143270. I.M.C. is supported by NIH grant R50 CA274336. P.S.N. is supported by R01 CA234715-01A1, R01 CA266452 and PC230420.
Y.W. is supported by the TFRI Prostate Cancer Program project TFRI number 1109. A.R.S. is supported by R35 GM19835. G.H. is supported by DP2 CA280624.
J.K.L. is supported by NIH DP2 CA271301. S.L.A. is supported by R01 NS119525. S.L.A. is an investigator of the Howard Hughes Medical Institute.
This work was supported by the Pacific Northwest Prostate Cancer SPORE (P50 CA097186), NIH grant P01 CA163227, the Richard M. Lucas Foundation, and the Institute for Prostate Cancer Research (IPCR). Author information Authors and Affiliations Human Biology Division, Fred Hutchinson Cancer Center, Seattle, WA, USA Yeon Soo Kim, Sonali Arora, Dave Young, Ava Tsou, Amy Shiuan, Cynthia L.
Wladyka, Dmytro Rudoy, Jin Yeong Kim, Jennifer A. Waters, Samantha L. Schuster, Ilsa M.
Coleman, Peter S. Nelson, Gavin Ha, Michael C. Haffner & Andrew C.
Hsieh Computational Biology Section of the Public Health Sciences Division, Fred Hutchinson Cancer Center, Seattle, WA, USA Samantha L. Schuster, Gavin Ha & Arvind R. Subramaniam Department of Cellular and Molecular Medicine, School of Medicine, University of California, San Diego, La Jolla, CA, USA Mridu Kapur & Susan L.
Ackerman The Howard Hughes Medical Institute, La Jolla, CA, USA Mridu Kapur & Susan L. Ackerman Department of Biochemistry and Molecular Biology, University of Chicago, Chicago, IL, USA Marek Sobczyk, Christopher D. Katanski, Amin M.
Bayat Tork, Wen Zhang & Tao Pan MesoRNA, Chicago, IL, USA Christopher D. Katanski Clinical Research Division, Fred Hutchinson Cancer Center, Seattle, WA, USA Peter S. Nelson & Andrew C.
Hsieh Department of Medicine, University of Washington, Seattle, WA, USA Peter S. Nelson & Andrew C. Hsieh Department of Genome Sciences, University of Washington, Seattle, WA, USA Peter S.
Nelson, Arvind R. Subramaniam & Andrew C. Hsieh Department of Pathology and Laboratory Medicine, University of Washington, Seattle, WA, USA Peter S.
Nelson & Michael C. Haffner Department of Urology, University of Washington, Seattle, WA, USA Eva Corey & Colm Morrissey Prostate Centre at Vancouver General Hospital and University of British Columbia, Vancouver, British Columbia, Canada Yuzhuo Wang BC Cancer Research Institute, Vancouver, British Columbia, Canada Yuzhuo Wang Basic Science Division, Fred Hutchinson Cancer Center, Seattle, WA, USA Arvind R.
Subramaniam Division of Hematology/Oncology, Department of Medicine, David Geffen School of Medicine at UCLA, Los Angeles, CA, USA John K. Lee Department of Molecular and Medical Pharmacology, David Geffen School of Medicine at UCLA, Los Angeles, CA, USA John K. Lee Department of Neurobiology, University of California, San Diego, La Jolla, CA, USA Susan L.
Ackerman Authors Yeon Soo Kim Sonali Arora Dave Young Ava Tsou Amy Shiuan Cynthia L. Wladyka Dmytro Rudoy Jin Yeong Kim Jennifer A. Waters Samantha L.
Schuster Ilsa M. Coleman Mridu Kapur Marek Sobczyk Christopher D. Katanski Amin M.
Bayat Tork Wen Zhang Peter S. Nelson Gavin Ha Michael C. Haffner Eva Corey Colm Morrissey Yuzhuo Wang Arvind R.
Subramaniam John K. Lee Susan L. Ackerman Tao Pan Andrew C.
Hsieh Contributions Y.S.K., T.P. and A.C.H. conceived and designed the study. Y.S.K., S.A., J.A.W., I.M.C., M.S., C.D.K., S.L.S. and G.H. designed and performed the computational analysis and data interpretation. Y.S.K., D.Y., D.R., A.T., A.S., C.L.W., J.Y.K., A.M.B.T. and W.Z. designed and performed the experiments.
M.C.H. provided pathology assessment and interpretation. M.K. and S.L.A. developed the knockout and overexpression mouse models. A.R.S. developed the original AGA codon reporter and performed codon usage analysis.
E.C., C.M. and Y.W. provided PDX tissues and patient tissues for this study. MSR-seq data in Fig. 1a,b and Extended Data Fig.
1c,e,f,g were acquired and analysed by Y.S.K., S.A. and C.D.K. Northern blots and qPCR results in Figs. 1c,f , 2e , 3a,c,f , 4c,d and 5g,i and Extended Data Figs.
1i,j , 2a , 3b–d,h,i , 4c , 5b,c,e,g , 6d,e , 7a–h , 8f,g and 9e were generated by Y.S.K., D.Y., A.T. and A.S. Experiments in Figs. 1g–k , 2d,f,g , 3e,h , 4a,e,j , 5a–d,k,l–o and Extended Data Figs.
2d,e,i , 3j,k , 6a–c , 8h,i , 9a and 10a,d–f were executed by Y.S.K. RNA-seq, GSVA, CUT&RUN and polysome RNA-seq in Figs. 2b,d , 3b and 4b,f–i and Extended Data Figs.
3e,f , 5d,f,h , 7j–m , 8a–e and 9c were analysed and generated by Y.S.K. and S.A. Western blots in Figs. 2c , 3d,g and 5f,h,j and Extended Data Figs.
3g , 4b and 9d,f were performed by J.Y.K. Experiments in Figs. 2h,i , 3i and Extended Data Fig.
7i were carried out by Y.S.K. and D.R. RNA-seq data in Extended Data Figs. 1k,l and 2b,c were analysed and generated by Y.S.K. and I.M.C.
MSR-seq data in Fig. 1d,e and Extended Data Fig. 2f–h were prepared and conducted by J.A.W., M.S. and A.M.B.T. and analysed by Y.S.K. and S.A.
Polysome RNA-seq in Fig. 5e was performed by Y.S.K. and C.L.W. and analysed by S.A. Extended Data Fig.
4e was generated by C.L.W. Extended Data Figs. 2h–j were generated by Y.S.K. and J.A.W.
Extended Data Fig. 10b,c were generated by W.Z. Y.S.K. generated data visualization.
Y.S.K. and A.C.H. wrote the manuscript. Y.S.K., S.A., D.Y., D.R., A.T., A.S., C.L.W., J.Y.K., J.A.W., S.L.S., I.M.C., P.S.N., M.C.H., C.M., Y.W., A.R.S., J.K.L., T.P. and A.C.H. reviewed and edited the manuscript. T.P. and A.C.H. supervised the study.
P.S.N., S.L.A., T.P. and A.C.H. acquired funding for the study. Corresponding authors Correspondence to Tao Pan or Andrew C. Hsieh .
Ethics declarations Competing interests M.C.H. served as a paid consultant and received honoraria from Pfizer and Astra Zeneca and has received research funding from Merck, Novartis, Genentech, Promicell and Bristol Myers Squibb. C.M. has received funds from Genentech, Janssen and Novartis unrelated to the current work.
E.C. served as a paid consultant to DotQuant and received institutional sponsored research funding unrelated to this work from Astra Zeneca, AbbVie, Gilead, Sanofi, Zenith Epigenetics, Bayer Pharmaceuticals, Forma Therapeutics, Genentech, GSK, Janssen Research, Kronos Bio, Foghorn Therapeutics, K36 Therapeutics and MacroGenics.
S.L.A. is a member of the scientific advisory board of Tevard Biosciences. P.S.N. served as a paid consultant and received honoraria from Pfizer, Astrazeneca, Genentech and received research funding from Janssen from work unrelated to the current study. G.H. received research support from Pfizer and has consulted for Quest Diagnostics; all activities are unrelated to this work.
A.C.H. serves on the scientific advisory board of Interdict Bio. Peer review Peer review information Nature thanks Johann De Bono and the other, anonymous, reviewer(s) for their contribution to the peer review of this work. Peer reviewer reports are available.
Additional information Publisher’s note Springer Nature remains neutral with regard to jurisdictional claims in published maps and institutional affiliations. Extended data figures and tables Extended Data Fig. 1 Mature tRNA 1 Arg (UCU) but not fragments and select modifications fluctuate during lineage plasticity. a .
Schematic of tRNA classification using the arginine tRNA family as an example. b . Schematic of global mapping of all tRNA species during lineage plasticity. c . Volcano plot showing tRNA isoacceptor edgeR analysis of UMI-derived MSR-seq data. d .
Bar graph of tRNA Arg (UCU) isodecoders in LNCaP AD cells (n = 3 biological replicates); mean ± SEM. e . Volcano plot showing tRNA isodecoder edgeR analysis of UMI-derived MSR-seq data. f . Distribution of tRNA 1 Arg (UCU)-derived fragments detected by MSR-seq; mean ± SEM.
Wilcoxon rank-sum test. g . Modification frequency of individual bases in tRNA 1 Arg (UCU). Wilcoxon rank-sum test. h .
Graphic of Northern blot workflow. i . Validation of qPCR primers (left) and northern blot probe (right) for tRNA 1 Arg (UCU) using C4-2B CRISPR KO and addback cells. Compared to the control (A), cells nucleofected with tRNA-Arg-TCT−1−1 sgRNAs (T) showed no expression. tRNA 1 Arg (UCU) overexpression (U) restored the tRNA levels as measured by qPCR (n = 8 replicates) and northern blot; mean ± SEM. j .
QPCR of tRNA 1 Arg (UCU) in LNCaP AD and LP cells (n = 5 replicates, left) and C4-2B AD and LP cells (n = 6 replicates, right); mean ± SEM. Two-sided unpaired Welch’s t-test. k . Heatmap illustrating AR scores (ARG.6 and ARG.10) and normalized AR pathway gene expression across subtypes of prostate cancer cell lines. l .
Heatmap showing NE scores (NE.6 and NE.10) and normalized NE pathway gene expression across subtypes of prostate cancer cell lines. For f , g , n.s. (not significant) = P > 0.05. Adjusted P values are provided in Supplementary Table 12 .
Schematics in panels a , b and h were created in BioRender. Kim, Y. S. https://biorender.com/v3k6ilv (2026).
Source data Extended Data Fig. 2 tRNA 1 Arg (UCU) expression is decreased in NEPC tumors. a . Northern blot of charged tRNA 1 Arg (UCU) and 5s rRNA from LTL331 PDX tissues.
Three biological replicates are shown. Box demarcates northern blot shown in Fig. 1f . b .
Heatmap displaying AR scores (ARG.6 and ARG.10) and normalized AR pathway gene expression across the LTL331 PDX series. Three LTL331 subtypes (Pre, Cx, R) are shown. c . Heatmap demonstrating NE scores (NE.6 and NE.10) and normalized NE pathway gene expression across the LTL331 PDX series.
Three LTL331 subtypes (Pre, Cx, R) are shown. d-e . Whole mount images of the UW rapid autopsy program TMA slides showing a diverse range of tRNA 1 Arg (UCU) ( d ) and a negative control dapB ( e ) expression across tumors from the basescope assay. Pink puncta indicate signal detected by the probe.
Scale bar, 5 mm. f . Correlation plot between average tRNA 1 Arg (UCU) tRNA puncta from the BaseScope assay and tRNA 1 Arg (UCU) abundance from MSR-seq (n = 24 patients). Spearman’s r and two-sided P value shown.
The solid line indicates the linear regression fit and the shaded area represents the 95% confidence interval. TAN = Tissue Acquisition Necropsy. g . Modification frequency derived from MSR-seq of individual bases in tRNA 1 Arg (UCU) between samples with highest and lowest number of tRNA 1 Arg (UCU) puncta from the UW rapid autopsy cohort (n = 3 for each group); Wilcoxon rank-sum test. h .
Volcano plot showing differential tRNA isodecoder expression between AR+ and NE+ UW rapid autopsy patient tissues. i . Venn diagram of downregulated tRNA isodecoders between LNCaP LP cells and UW rapid autopsy NE+ patient tissues. For g , n.s. (not significant) = P > 0.05.
Adjusted P values are provided in Supplementary Table 12 . Source data Extended Data Fig. 3 tRNA 1 Arg (UCU) knockdown decreases AR dependence and promotes NE features. a .
Schematic of shRNA-mediated tRNA 1 Arg (UCU) knockdown. b . tRNA 1 Arg (UCU) qPCR in LNCaP shScr and shUCU cells (n = 4 replicates, left) and C4-2B shScr and shUCU cells (n = 3 replicates, right); mean ± SEM. c . Northern blots of charged tRNA Arg (UCU) isodecoders. d . QPCR of AR pathway expression of shScr and shUCU LNCaP (n = 4 replicates, left) and C4-2B (n = 3 replicates, right) cells; mean ± SEM. e .
GSVA of AR, SNAI1, and prostate cancer metastasis pathway activity from LNCaP shScr and shUCU cells. f . GSVA of AR, NE, ASCL1, SOX2, prostate cancer metastasis pathway activity from C4-2B shScr and shUCU cells. g . Immunoblot of ASCL1 in C4-2B cells. h .
QPCR of AR pathway and tRNA 2 Arg (CCG) expression of shScr and shCCG C4-2B (n = 4 replicate) cells; mean ± SEM. i . QPCR of AR pathway and tRNA 3 Arg (UCG) expression of shScr and shUCG C4-2B (n = 3 replicate) cells; mean ± SEM. j . Confluence of shScr and shUCU LNCaP cells treated with 10 μM apalutamide (n = 6 replicates) or 5 μM darolutamide (n = 5 replicates), and shScr and shUCU C4-2B cells (right) treated with 30 μM apalutamide (n = 6 replicates) or 30 μM darolutamide (n = 6 replicates); mean ± SEM. k .
Confluence of shScr and shUCU C4-2B cells treated with alisertib 10 μM (n = 8 replicates) or 20 μM (n = 7 replicates); mean ± SEM. For b , d , h , i , j , k , two-sided unpaired Welch’s t-test was used. Schematic in panel a was created in BioRender.
Kim, Y. S. https://biorender.com/ccni989 (2026). Source data Extended Data Fig.
4 Development of a Hi-Myc mouse model haploinsufficient for tRNA-Arg-TCT−1−1 . a . Schematic of mouse prostate organoid establishment from Hi-Myc; n-Trtct2 +/+ and Hi-Myc; n-Trtct2 +/− models. Prostates from 8−12-week-old male mice were harvested and minced into small pieces using a blade.
The prostate tissuewas dissociated with collagenase I for 1 h at 37 °C and Trypsin-EDTA 0.05% for 5 min at 37 °C. Dissociated cells were filtered through an 18 G needle and 40 μm strainer. Single cells were incubated with CD49f-PE and EpCAM-APC for FACS sorting to enrich for prostate basal cell populations.
After sorting, cells were deposited into Matrigel and grown in organoid medium. For more details, refer to the Methods . b . Immunoblot of Myc in mouse prostate organoids.
Vinculin is a loading control. c . Representative northern blot of charged tRNA 1 Arg (UCU) of prostate organoids from Hi-Myc; n-Trtct2 +/+ and Hi-Myc; n-Trtct2 +/− mice. 5 s rRNA is a loading control. d .
Timeline of castration surgery and prostate harvest. Hi-Myc; n-Trtct2 +/+ and Hi-Myc; n-Trtct2 +/− mice were aged for 9 months for tumor development in the prostate. For the castration group, the surgery was conducted at 9 months of age and prostates were harvested 2 months after.
For uncastrated group, prostates were harvested at 11 months of age without surgery. e . Representative IHC images of Myc protein levels across prostate lobes in a Hi-Myc; n-Trtct2 +/+ mouse. Ventral and anterior prostate lobes have higher Myc expression than dorsal/lateral lobes.
Scale bar, 100 μm. Schematics in panels a and d were created in BioRender. Kim, Y.
S. https://biorender.com/z15unau (2026). Extended Data Fig. 5 tRNA-mediated lineage plasticity in prostate cancer is tRNA 1 Arg (UCU)-specific. a .
Schematic showing the plasmid design for tRNA 1 Arg (UCU) overexpression and experimental workflow. b . Northern blots of charged tRNA Arg (UCU) isodecoders 2-5 of LNCaP AD, LP, and UCU cells (above) and C4-2B AD, LP, and UCU cells (below). 5 s rRNA is a loading control. c .
NE pathway gene expression analysis by qPCR in LNCaP AD, LP, and UCU cells (n = 5 replicates, above) and C4-2B AD, LP, and UCU cells (n = 6, below); mean ± SEM. One-way ANOVA with Šídák’s multiple-comparisons test. d . Volcano plot of RNA-seq from LNCaP LP and UCU cells.
AR pathway genes from ARG. 10 and Tang et al. ATAC-seq data ( ELL2 , HPGD , LYPLAL1 , MPC2 , ZNF331 ) 19 are highlighted in yellow. e .
Northern blots of tRNA Arg (UCU) isodecoders 2-5 and 5 s rRNA in LNCaP LP and LP cells with tRNA Arg (UCU) isodecoders 2-5 overexpression, respectively. 5 s rRNA is a loading control. f . Volcano plots of RNA-seq from LNCaP LP and LP cells with tRNA Arg (UCU) isodecoders 2-5 overexpression.
AR pathway genes from ARG.10 and Tang et al. ATAC-seq data ( ELL2 , LYPLAL1 , MPC2 , ZNF331 ) 19 are highlighted in yellow. g . Northern blots of tRNA 1 Arg (ACG), tRNA 2 Arg (CCG), tRNA 4 Arg (CCU) and 5 s rRNA in LNCaP LP and LP with tRNA 1 Arg (ACG), tRNA 2 Arg (CCG), or tRNA 4 Arg (CCU) overexpression cells, respectively.
5s rRNA is a loading control. h . Volcano plots of RNA-seq from LNCaP LP and LP cells with tRNA 1 Arg (ACG), tRNA 2 Arg (CCG), or tRNA 4 Arg (CCU) overexpression. AR pathway genes from ARG.10 and Tang et al.
ATAC-seq data ( ELL2 , HPGD , LYPLAL1 , MPC2 , ZNF331 ) 19 are highlighted in yellow. Schematic in panel a was created in BioRender. Kim, Y.
S. https://biorender.com/eh000ak (2026). Source data Extended Data Fig. 6 tRNA 1 Arg (UCU) addback demonstrates the reversible nature and therapeutic opportunity of tRNA-mediated lineage plasticity. a .
Baseline-normalized cell survival relative to vehicle-treated controls for each biological replicate. 5 or 10 μM apalutamide treatment in LNCaP AD, LP, and UCU cells (5 μM, n = 8 replicates; 10 μM, n = 9 replicates, left) and 30 μM apalutamide treatment in C4-2B AD, LP, and UCU cells (n = 8 replicates, right); mean ± SEM.
One-way ANOVA with Šídák’s multiple-comparisons test. b . Baseline-normalized cell survival relative to vehicle-treated controls for each biological replicate. 5 or 10 μM darolutamide treatment in LNCaP AD, LP, and UCU cells (5 μM, n = 9 replicates; 10 μM, n = 7 replicates, left) and 10 μM darolutamide treatment in C4-2B AD, LP, and UCU cells (n = 4 replicates, right); mean ± SEM.
One-way ANOVA with Šídák’s multiple-comparisons test. c . Baseline-normalized cell survival relative to vehicle-treated controls for each biological replicate. 2 μM alisertib treatment in LNCaP AD, LP, and UCU cells (n = 9 replicates, left) and 10 or 20 μM alisertib treatment in C4-2B AD, LP, and UCU cells (10 μM, n = 6 replicates; 20 μM, n = 8 replicates, right); mean ± SEM.
One-way ANOVA with Šídák’s multiple-comparisons test. d . Northern blot of tRNA 1 Arg (UCU) and 5 s rRNA in WT and UCU LNCaP-abl cells. e . tRNA Arg (UCU)−1 expression analysis by qPCR in WT and UCU LNCaP-abl cells (n = 5 replicates); mean ± SEM. Two-sided unpaired Welch’s t-test. f .
Timeline of castration surgery and prostate harvest in the TRAMP model. Schematic in panel f was created in BioRender. Kim, Y.
S. https://biorender.com/dnb6qr1 (2026). Source data Extended Data Fig. 7 TARDBP and ZSCAN29 regulation of tRNA 1 Arg (UCU) and lineage plasticity. a-b .
QPCR of TARDBP or ZSCAN29 in LNCaP cells transfected with siRNA against TARDBP (n = 8 replicates) or ZSCAN29 (n = 8 replicates) or both (n = 8 replicates). c-d . QPCR of TARDBP or ZSCAN29 in C4-2B cells transfected with siRNA against TARDBP (n = 6 replicates) or ZSCAN29 (n = 6 replicates) or both (n = 6 replicates). e .
QPCR of ASH2L and ZBTB40 in LNCaP cells transfected with siRNA against ASH2L (n = 6 replicates, left) or ZBTB40 (n = 5 replicates, right). f . QPCR of tRNA Arg (UCU)−1 in LNCaP cells transfected with siRNA against ASH2L (n = 6 biological replicates, left) or ZBTB40 (n = 5 replicates, right). g .
QPCR of ASH2L and ZBTB40 in C4-2B cells transfected with siRNA against ASH2L (n = 6 replicates, left) or ZBTB40 (n = 3 replicates, right). h . QPCR of tRNA 1 Arg (UCU) in C4-2B cells transfected with siRNA against ASH2L (n = 6 biological replicates, left) or ZBTB40 (n = 3 biological replicates, right). i .
Representative immunofluorescence images of TARDBP (red; above) and ZSCAN29 (green; below) with nuclear staining (DAPI)(AD, n = 11 replicates (423 nuclei); LP, n = 9 replicates (418 nuclei)). Quantification of nuclear MFI (right); mean ± SEM. Scale bar, 20 μm. j-m .
Correlation plots between TARDBP (left) or ZSCAN29 (right) expression and the NE score (NE.10) ( j ), ASCL1 pathway score ( k ), SOX2 pathway score ( l ), EMT pathway score ( m ), with Spearman’s r and two-sided P value shown (n = 222 patient tissues). For a-d , Kruskal-Wallis test followed by Dunn’s multiple-comparisons test was used.
For e-i , two-sided unpaired Welch’s t-test was used. For a- i, the panels display data with mean ± SEM. Source data Extended Data Fig.
8 Lineage transitions reduce the levels of H3K4me3 and RNA polymerase III, TARDBP, ZSCAN29 binding at the tRNA-Arg-TCT−1−1 gene locus, and RNA polymerase III binding is TARDBP and ZSCAN29-dependent. a . Volcano plot showing differential binding of TARDBP (left) and ZSCAN29 (right) at all tRNA gene loci between LNCaP LP versus AD cells. b .
Venn diagram of tRNA genes with decreased TARDBP and ZSCAN29 binding in LNCaP LP versus AD cells. c . Volcano plot of MSR-seq isodecoder analysis in Fig. 1b . tRNAs with decreased binding of both TARDBP and ZSCAN29 in LNCaP LP cells are highlighted in yellow. d .
H3K4me3 signal density plot at the tRNA-Arg-TCT-2−1 locus. e . POLR3A signal density plot at the tRNA-Arg-TCT−1-1 locus (left) and at other tRNA-Arg-TCT isodecoder loci (right). f . Northern blot of tRNA 1 Arg (UCU) (above), isodecoders 2-5 (below) and 5s rRNA in LNCaP cells transfected with non-targeting siRNA or siRNA against TARDBP or ZSCAN29 (n = 3 replicates). g .
Northern blot of tRNA 1 Arg (UCU) (above), isodecoders 2-5 (below) and 5 s rRNA in C4-2B cells transfected with non-targeting siRNA or siRNA against TARDBP or ZSCAN29 (n = 3 replicates). h . Analysis of TARDBP (left) or ZSCAN29 (right) binding at the tRNA-Arg-TCT−1−1 locus by ChIP-qPCR in LNCaP cells transfected with non-targeting siRNA or siRNA against TARDBP (n = 5 replicates) or ZSCAN29 (n = 5 replicates); mean ± SEM.
Kruskal-Wallis test with Dunn’s multiple- comparisons test. i . Analysis of TARDBP (left) or ZSCAN29 (right) binding at the tRNA-Arg-TCT−1−1 locus by ChIP-qPCR in C4-2B cells transfected with non-targeting siRNA or siRNA against TARDBP (n = 4 replicates) or ZSCAN29 (n = 4 replicates); mean ± SEM.
Kruskal-Wallis test with Dunn’s multiple- comparisons test. Source data Extended Data Fig. 9 tRNA 1 Arg (UCU) drives the translation of a regulon of transcription regulators and tRNA 1 Arg (UCU) depletion accelerates prostate cancer metastasis in vivo. a .
Schematic of Arg-AGA codon read-through reporters and representative IF images. Quantification of mCherry:EBFP2 signal ratio using Imaris image analysis software (right) (2x AD, n = 4 replicates (184 cells); 2x LP, n = 4 replicates (1030 cells); 2x UCU, n = 4 replicates (497 cells); 4x AD, n = 4 replicates (494 cells); 4x LP, n = 4 replicates (918 cells); 4x UCU, n = 4 replicates (781 cells); 6x AD, n = 4 replicates (118 cells); 6x LP, n = 4 replicates (873 cells); 6x UCU, n = 4 replicates (205 cells); mean ± SEM.
Kruskal-Wallis test with Dunn’s multiple-comparisons test. Scale bar, 10 μm. b . Workflow of the polysome profiling experiment. c .
GSEA analysis of 2,365 translationally upregulated mRNAs in the black box on Fig. 5e . d . Immunoblot of SMARCB1 in LNCaP AD, LP, UCU cells. e .
QPCR of SMARCC2 in LNCaP UCU shScramble and shSMARCC2 cells (n = 3 replicates); mean ± SEM. Two-sided unpaired Welch’s t-test. f . Immunoblot of SMARCC2 in LNCaP UCU shScramble and shSMARCC2 cells. g .
Workflow of the in vivo metastasis assay. h . Representative images of bioluminescence signal from individual mice in the shScr and shUCU groups. * mouse expired day 56 from brain metastasis, image taken on day 56. i . Time-course measurement of bioluminescence signal from the shScr (left) and shUCU (right) groups.
Individual lines indicate each mouse. j . Stacked bar graph showing the percentage of mice in shScr (n = 10) and shUCU (n = 10) groups that developed metastasis. Two-sided Fisher’s exact test.
Schematics in panels b and g were created in BioRender. Kim, Y. S. https://biorender.com/grwtndx (2026).
Source data Extended Data Fig. 10 tRNA 1 Arg (UCU) has unique base pairings that are not present in other tRNA Arg (UCU) isodecoders and Notch signaling is a potential upstream regulator of TARDBP and ZSCAN29. a . (Above) Sequences of tRNA Arg (UCU) isodecoder members (above). The anticodon UCU is highlighted in red. (Below) Structures of tRNA Arg (UCU) isodecoders with unique and common bases labelled.
Unique base pairs in tRNA 1 Arg (UCU) but not in tRNA Arg (UCU) isodecoders 2, 3 and 5 are circled. b . Cryo-EM image of direct interactions of the 3 base pairs that differ among tRNA 1 Arg (UCU) and tRNA Arg (UCU) isodecoders 2, 3 and 5 in the eEF1A-tRNA complex. A-site tRNA interaction with eEF1A1 (pdb 8G60 ), highlighting C6-G67, C49-G65, and C50-G64 pairs in red. c .
Cryo-EM images showing direct interactions of the 3 base pairs in ribosome A (left), P (middle) andE (right) sites. (Left) A-site tRNA interaction with ribosome (pdb 6Y0G ), highlighting C6-G67, C49-G65, and C50-G64 pairs in red. (Middle) P-site tRNA interaction with ribosome (pdb 8G60 ), highlighting C6-G67, C49-G65, and C50-G64 pairs in red. (Right) E-site tRNA interaction with ribosome (pdb 6QZP ), highlighting C6-G67, C49-G65, and C50-G64 pairs in red. d .
Venn diagram of transcription factors that bind to the TARDBP or ZSCAN29 gene locus and neighboring regions from ENCODE. e . Pie chart reveals that 82 of the 288 transcription factors that bind to the TARDBP and ZSCAN29 gene locus decrease in the context of lineage plasticity. f .
GSEA of 82 downregulated transcription factors found in Extended Data Fig. 10e . Five categories in Reactome involve Notch signaling pathways (NOTCH1 Intracellular Domain Regulates Transcription R−HSA−2122947, Constitutive Signaling By NOTCH1 HD+PEST Domain Mutants R−HSA−2894862, Notch−HLH Transcription Pathway R−HSA−350054, Signaling By NOTCH1 R−HSA−1980143, NOTCH4 Intracellular Domain Regulates Transcription R−HSA−9013695) were identified. tRNA structures in panel a were generated from https://rnacentral.org/r2dt and edited in Adobe Illustrator.
Cryo-EM images in panels b , c were obtained from the Protein Data Bank (PDB) and modified for presentation. Source data Rights and permissions Open Access This article is licensed under a Creative Commons Attribution-NonCommercial-NoDerivatives 4.0 International License, which permits any non-commercial use, sharing, distribution and reproduction in any medium or format, as long as you give appropriate credit to the original author(s) and the source, provide a link to the Creative Commons licence, and indicate if you modified the licensed material.
You do not have permission under this licence to share adapted material derived from this article or parts of it. The images or other third party material in this article are included in the article’s Creative Commons licence, unless indicated otherwise in a credit line to the material.
If material is not included in the article’s Creative Commons licence and your intended use is not permitted by statutory regulation or exceeds the permitted use, you will need to obtain permission directly from the copyright holder. To view a copy of this licence, visit http://creativecommons.org/licenses/by-nc-nd/4.0/ .
Reprints and permissions About this article Cite this article Kim, Y.S., Arora, S., Young, D. et al. tRNA dosage regulates lineage dependency and resistance in prostate cancer. Nature (2026). https://doi.org/10.1038/s41586-026-11153-8 Download citation Received : 12 August 2025 Accepted : 11 September 2026 Published : 07 October 2026 Version of record : 07 October 2026 DOI : https://doi.org/10.1038/s41586-026-11153-8
Article text via FreeNewsAPI. Rights remain with Nature.
Read on publisher site → Opens Nature in a new tab